[Update: I had apparently been updating my own git repo for this project, rather than the BAMResearch one… that has now been fixed and you should be able to download a much more up-to-date version now]
Another useful tool for getting users familiar with model and model combinations is this interactive tool that lets you interactively explore them with sliders and a responsive UI. I’ve been working on the SasModels Explorer for a bit to do just this. Read on for some pretty screenshots and more…

The SasModels library is the cornerstone of the expansive SasView fitting tool. As the name suggests, the SasModels library contains the analytical models for many shapes and functions, such as “sphere”, “cylinder”, the Debye-Anderson-Brumberger “dab” and “porod” models, in addition to structure factors such as “hardsphere”. but also allows easy composition of these into more complex models.
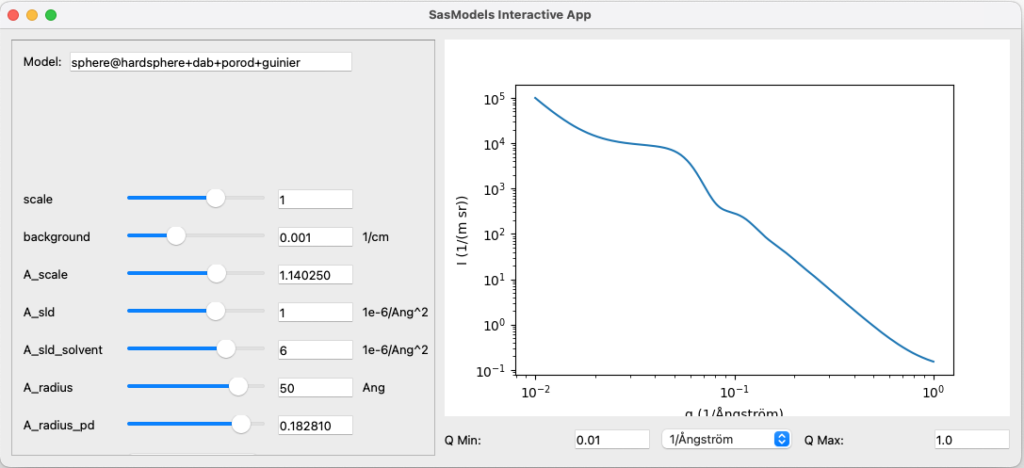
That means you can add, multiply, divide and subtract model combinations, and apply structure factors as well. So by writing “sphere@hardsphere+cylinder+porod”, you get a combined model with all these features (the parameters will be preceded by a letter and underscore, e.g. “A_” for the first component).
Making and exploring composite models in SasView, however, is a bit of a tedious process (SASfit has a comparatively easier way of doing this). On top of that, exploring how model parameters affect the model scattering curve involves entering values in text boxes and clicking “calculate” for every change.

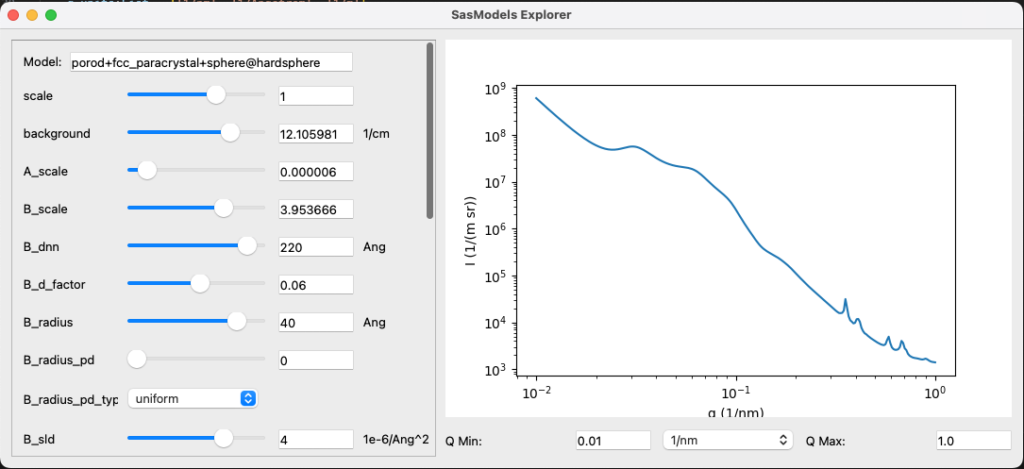
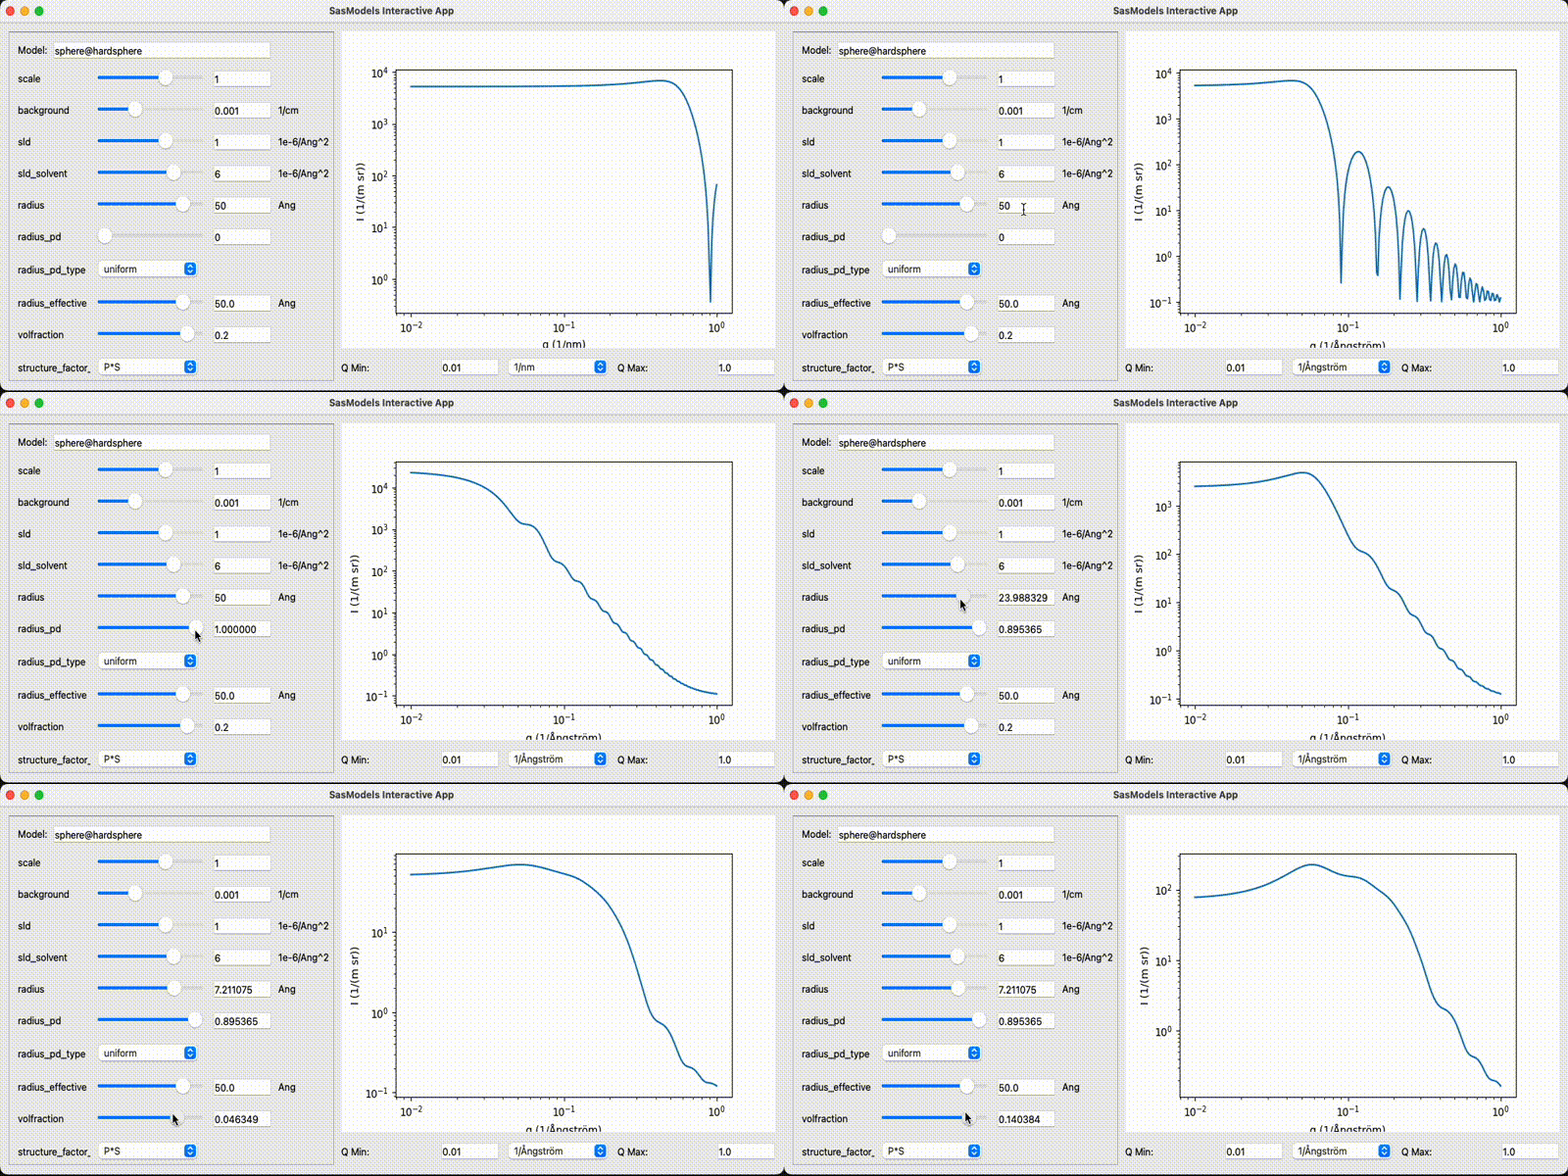
So I wrote the SasModels Explorer as an easy way of creating and interacting with models. It’s a simple QT5-based UI that can be started from the command line. You can specify a model on the command line already to start with (but this can be changed later in the UI). A UI is launched with a graph on the right-hand side, and the model and its parameters on the left-hand side. log-sliders are added to the floating point parameters, and pulldown menus for parameters with a list of options. Dragging on the log sliders immediately affects the model curve, at least for the simpler models.
Typing a new model or model combination in the model entry textbox lets you explore new ones (if your model name can’t be found, a list is shown with the available models). At the moment, there’s still a small bug in the UI which does not clean up the previous parameter interface completely, and therefore shifts the new parameter inputs down a bit, but that’s only a minor annoyance.

A second caveat is that there is no way to stop slow calculations. If you decide to set up a complex model with, for example, many numerical integrations, this will slow the interface down to the point it’s no longer usable. Thirdly, the log sliders all max out at 1000 at the moment, which may occasionally be limiting.
Nonetheless, the interface is fun to use, and I recommend those who want to play to download it and have a go at it. Please let me know if you use this in a classroom or something, so I can feel good about the time spent on its development. Also, if you have improvements or suggestions, please do not hesitate to contribute them in a pull request or add them to the GitHub issue list.
The final hope is that this UI can be included as a tool in SasView, or perhaps inspire alternative methods for model building, initial parameter setting, or even a simple fitting interface. Given its modular nature and QT backend, that is hopefully not too far off the realm.
