When researchers ask if we can measure their samples, the usual, unsatisfying answer is: “It depends…”. That’s because the detectablity of their dispersed scatterers depends on the contrast between the scatterer and the surrounding matrix, as well as the concentration of said scatterers. The detection limits are furthermore dependent on the signal-to-noise ratio of a given instrument. Here, then, is a handy tool for you to estimate the detection limits for your instrument for any kind of sample.

If you want it, download it here: http://www.lookingatnothing.com/wp-content/uploads/2018/06/DetectionLimits.xls.zip.
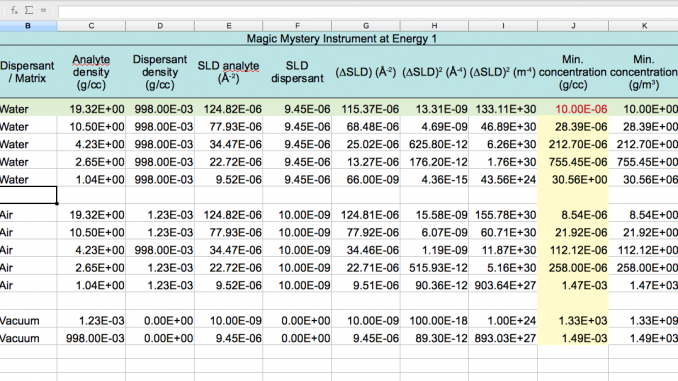
Ok, so it’s just an Excel sheet, but it’s still handy. In this sheet, every row is a combination of analyte and dispersant (specified in columns A and B), and you can change or add to these as much as you’d like.
The next four columns specify the gravimetric densities and the scattering length densities (in reciprocal square Ångström). These need to be filled in by you for the materials. Scattering length densities can be obtained from online calculators, such as this one from NIST.
The key of the sheet is the very first analyte/dispersant combination. This should be a measurement you have done in the past, and which you consider to be the lower limit of your equipment. For this sample, you need to fill in the concentration that you measured this at (in field J3).
In column J, then, are the minimum concentration estimates for all the other combinations using J3 as a reference value. Note that we do assume that you keep your pathlength the same, and we’re not considering absorption either.
A second item of interest is the polystyrene example. Polystyrene in water is notoriously hard to measure, as the densities are very similar. This creates a very high minimum concentration, and, if you look at the required volume fractions in the last column, an impossibly high volume fraction. So no, we cannot measure polystyrene without improving our signal-to-noise ratio!
Let me finish by saying that the usual conditions apply: I’ve only done this as an estimate, haven’t double-checked if this works as intended, cannot guarantee that it will give you the right answer..
Updates and comments are very welcome!

Hello,
thanks for your post. It is very handy and compact and can be easily used for unknown samples from colleagues.
Your blog is great, thank you for your efforts.
Best regards from Berlin Adlershof
Robert
Thanks! I’m not sure if the assumptions in the sheet are correct, but please do let me know if there are any new findings on its validity from the HU-side of town :).