

It’s that time of the year again: we can take a look back at how we did in 2020. Also, as we’re currently having our first major downtime due to a broken fuse in the detector, the records from 2020 are likely to stand for a while to come. So let’s dive right in!
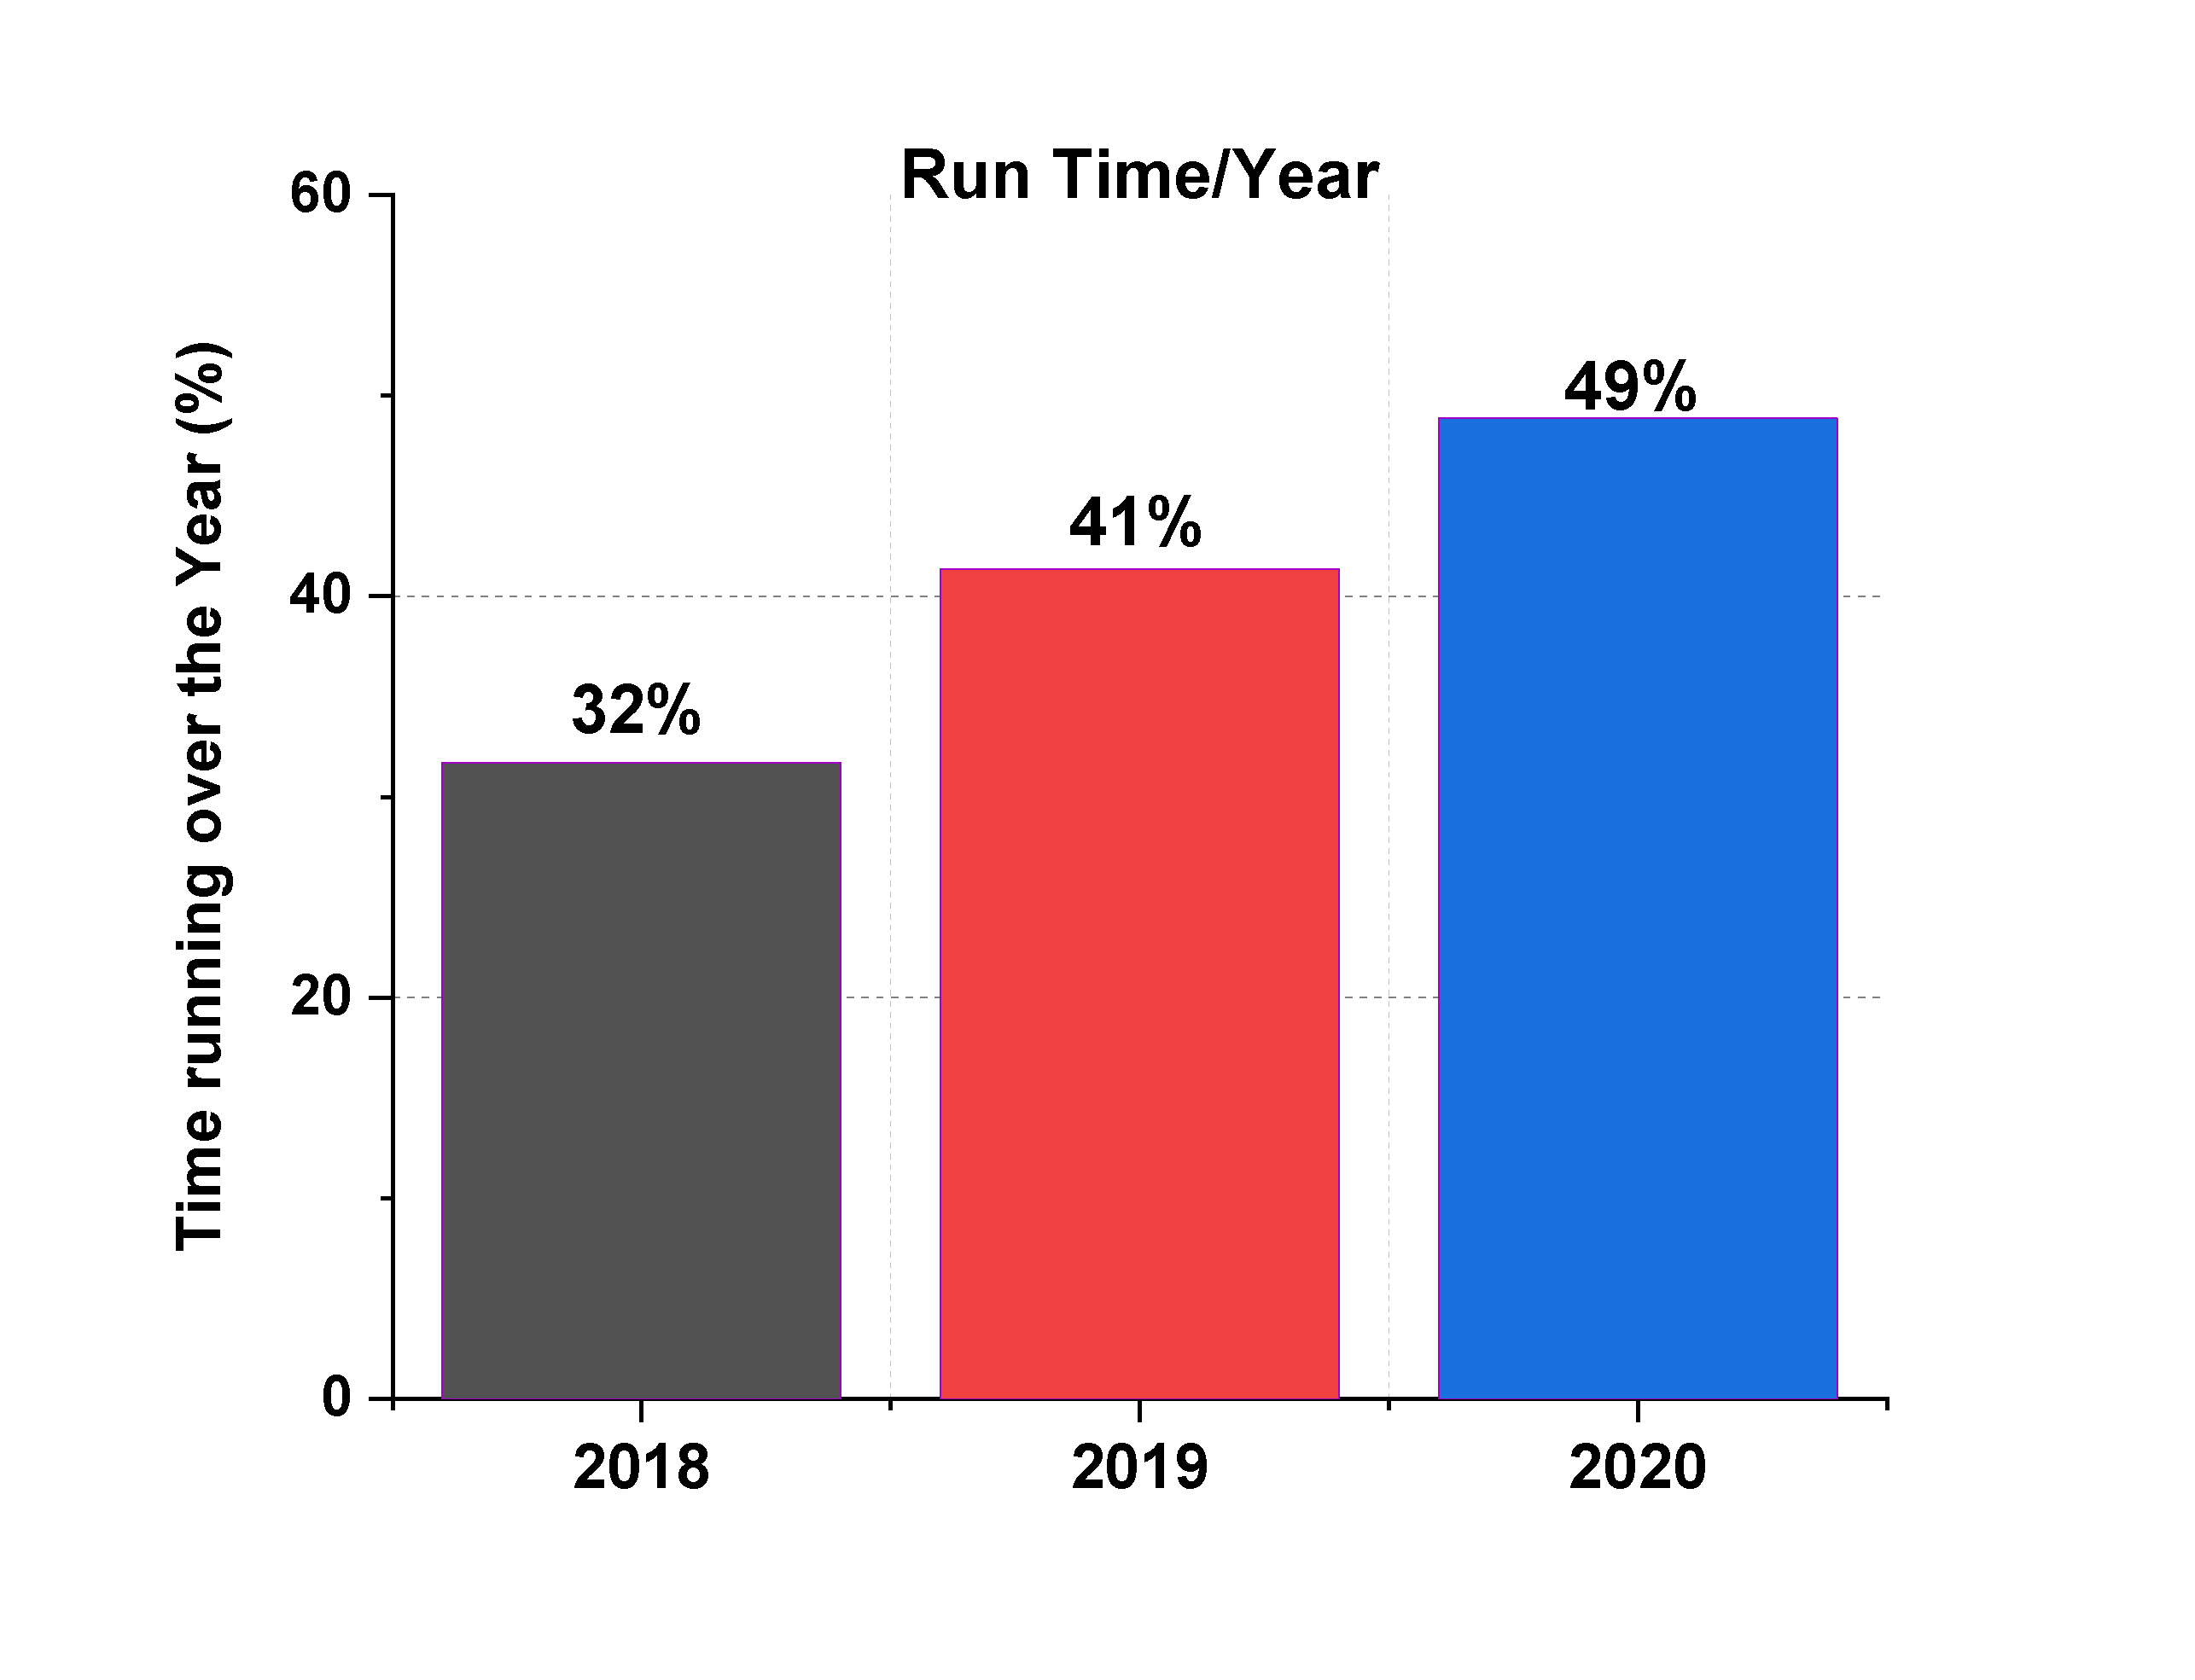
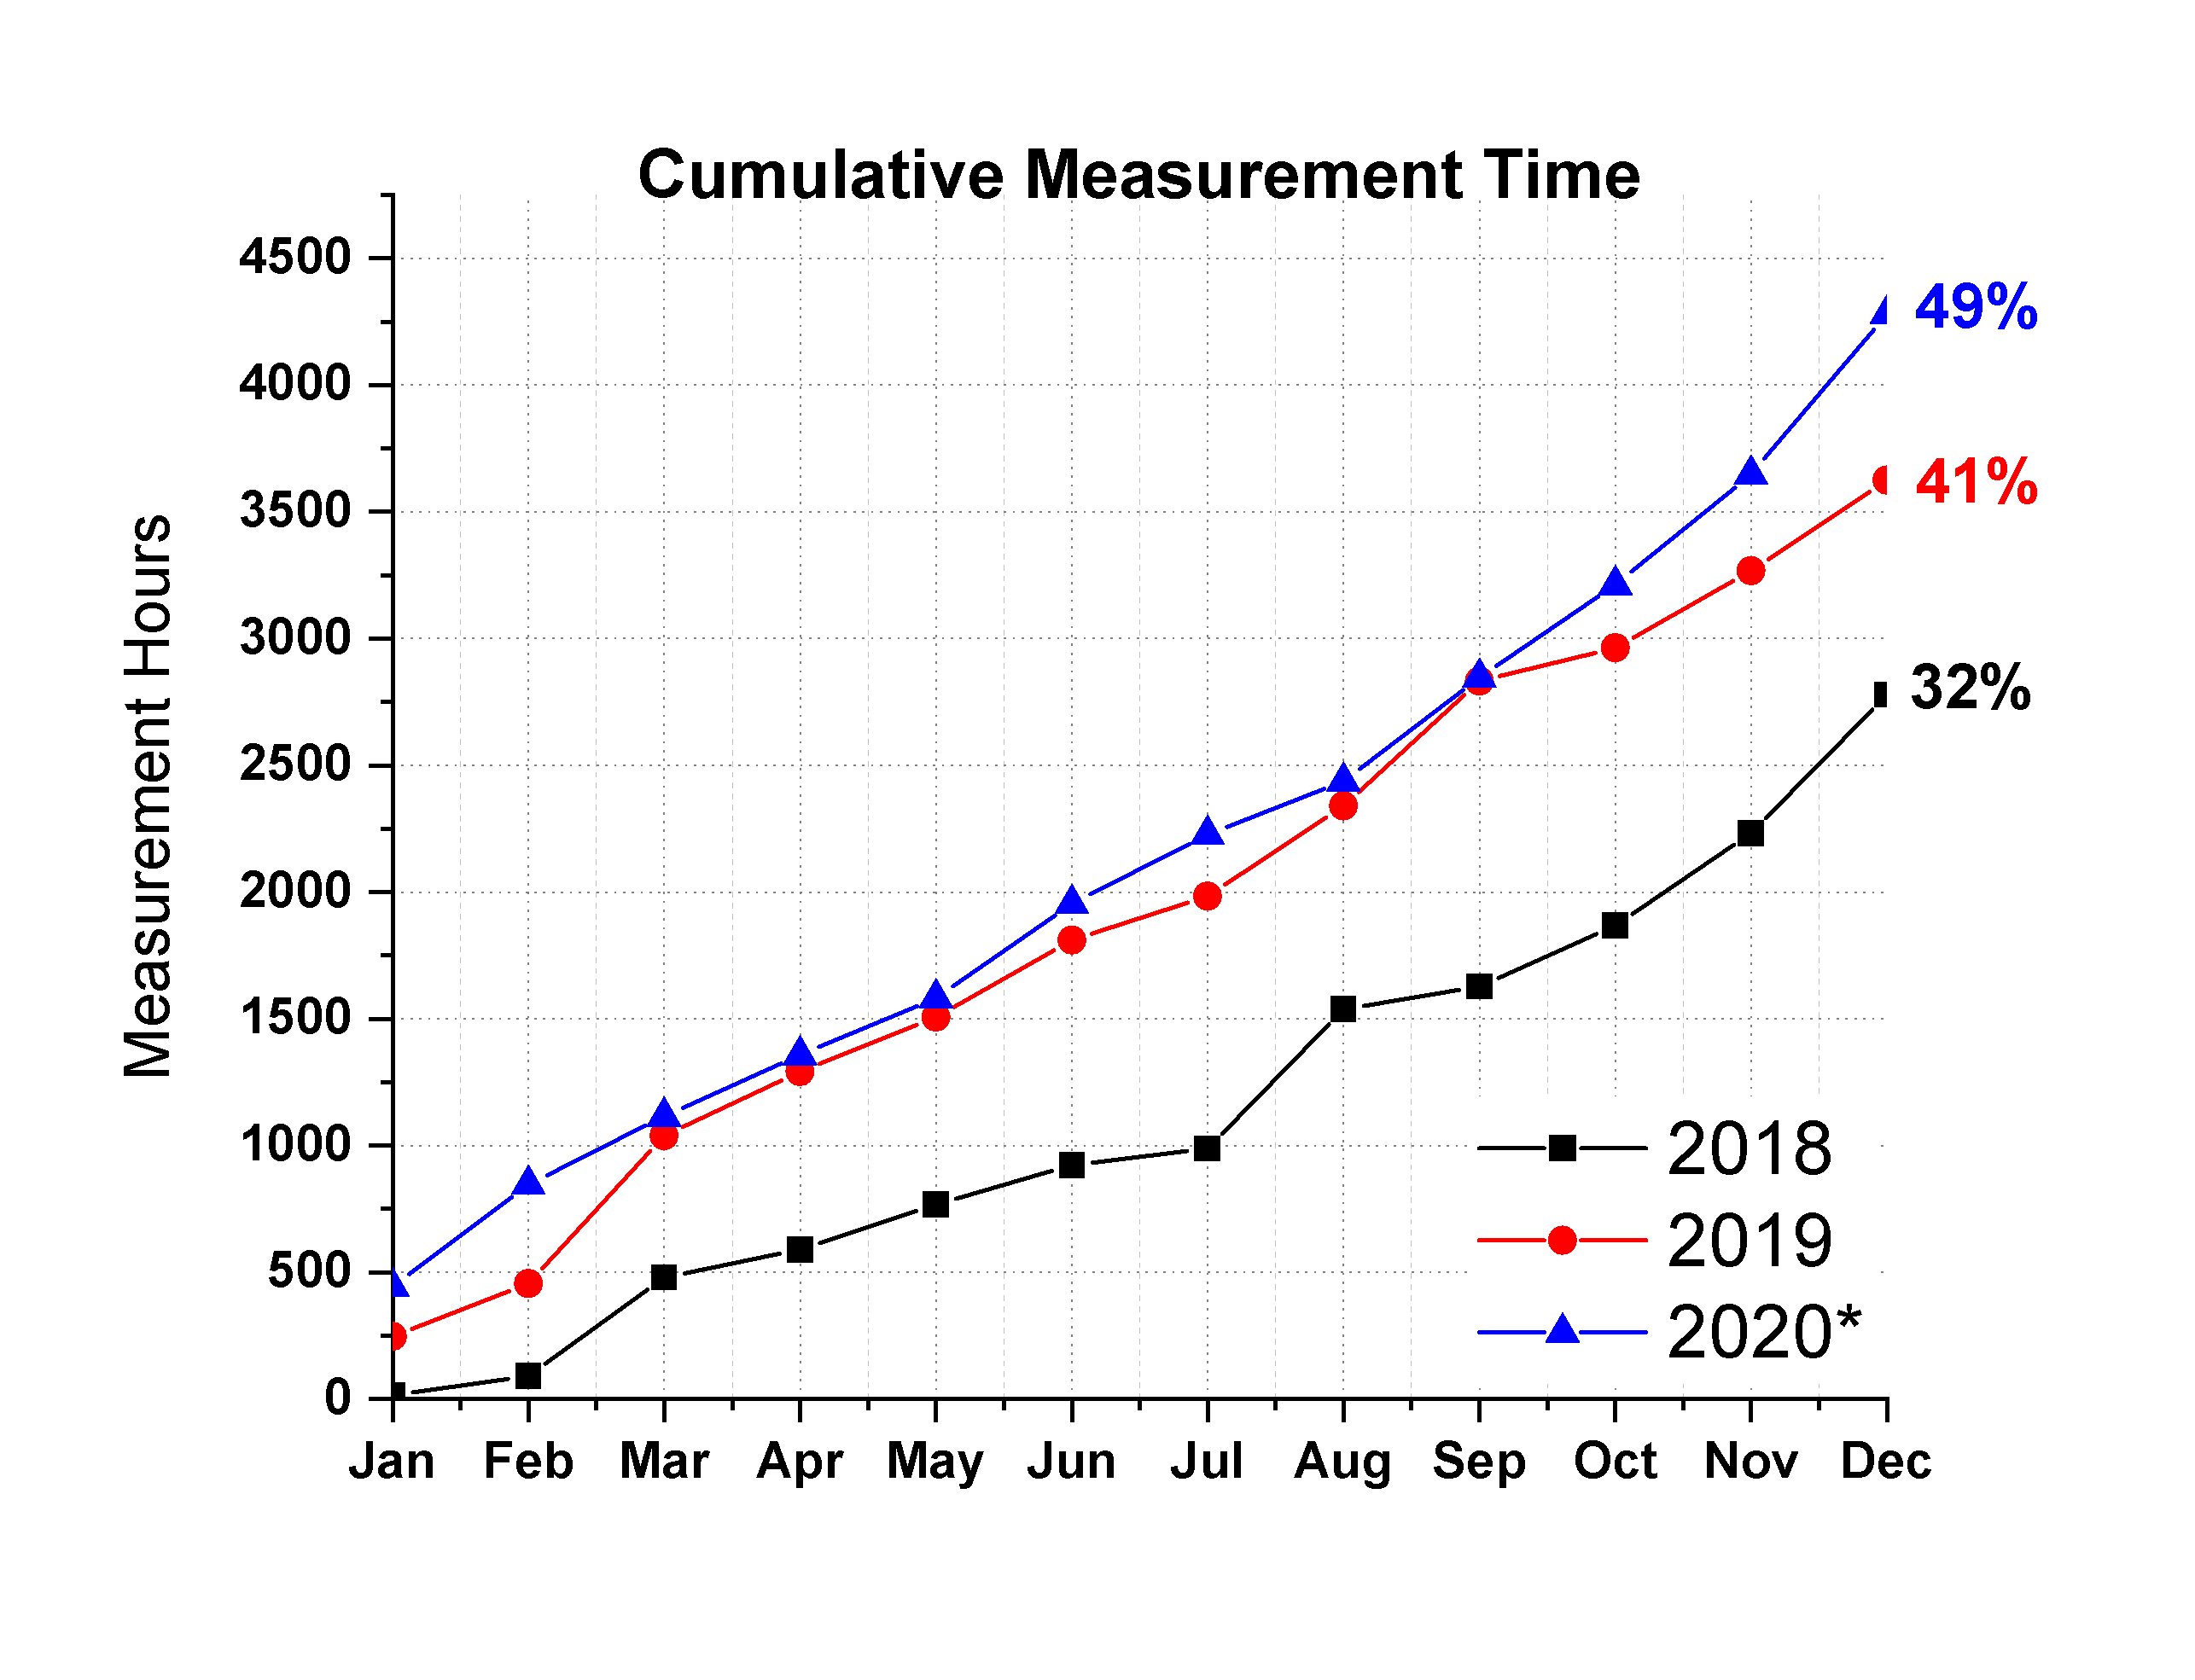
First up, total measurement time. Counting the total exposure time on the detector we spent on actual measurements, we arrive at 4280 hours, or about 178 days. That means the detector has been counting photons in its hard vacuum for nearly half a year last year. The data collection performance has been better pretty much every single month compared to last year:
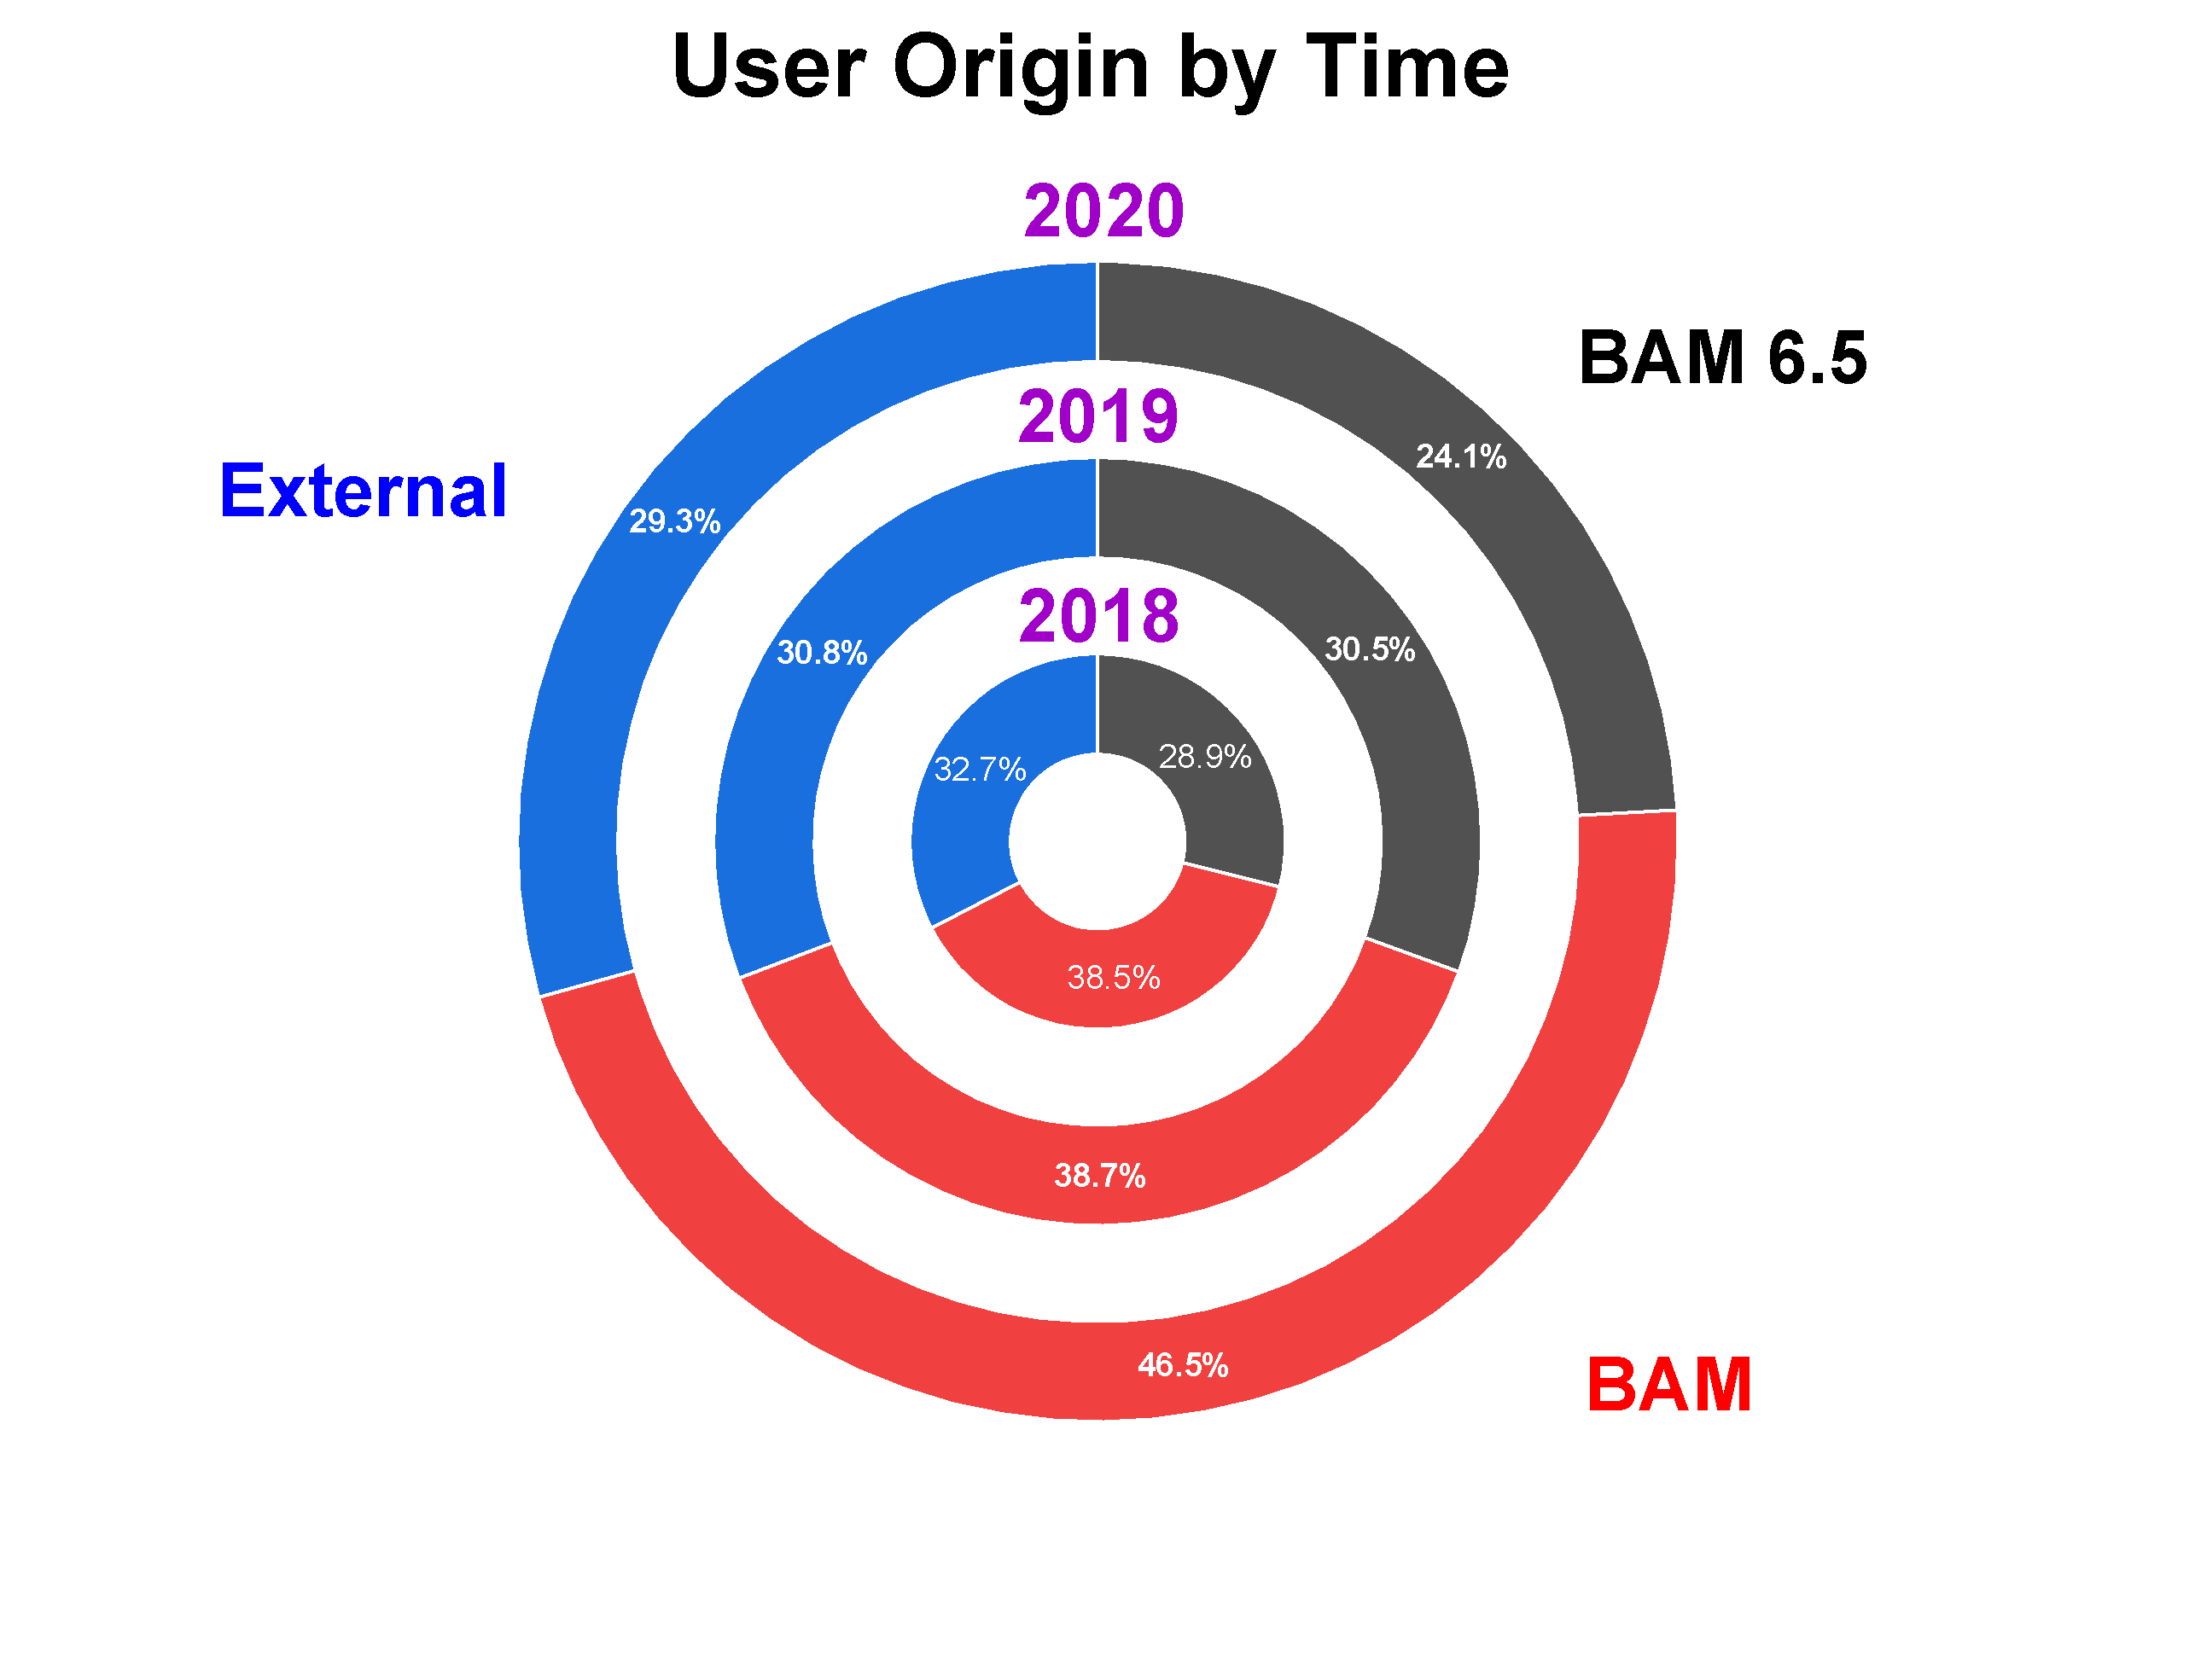
Similar to the previous years, 2020 had almost the same nice 1/3rd division when it came to user origin. 25% of our measurement time was spent on measurements for our own group, 47% on measurements from collaborating BAM groups, and 29% on measurements for our wonderful external users from 8 different countries. We’ve hosted users (and/or their samples) from many different universities and institutes across Germany, as well as from Sweden, Netherlands, UK, Finland, France, Japan and Switzerland.
Towards the end of 2020 I also redid the data translation and storage, meaning we now store more information in our raw data too (direct- and transmitted beam images are now included with the measurements). This is reflected in the data use over the years, but will impact 2021 more than 2020:
| Year: | 2018 | 2019 | 2020 |
| Data generated (TB) | 0.24 | 1.04 | 1.37 |
2020 also saw some results in terms of publications from the MOUSE data (though this was typically from data collected in 2019 or earlier). The Google Scholar page where we track the instrument papers shows that 2019 resulted in 6 instrument papers, and 2020 resulted in 8 papers. Of note is that for one of the composite papers, we also published the accompanying datasets and quite involved data evaluation script (Jupyter notebook). We hope to do this much more in the future, so others can have a look at the actual underlying data and in particular the all-important data interpretation which led to the conclusions. Some upcoming papers for 2021 include one that I’m very much looking forward to seeing out there: a massive tome (yet again) on the methodology we have developed around the MOUSE instrument, currently under review.
This year things are going to be a little different. This year we have our first real breakdown, which led to a continuing long shutdown. While this gives us some time to 1) do some repairs and cool upgrades (more about this in a future post), and 2) catch our breath, it also has some negative consequences. Firstly, we cannot measure samples for ongoing and new projects, and we cannot measure cool user’s samples for our upcoming “Better with Scattering” workshop either. Secondly, the upgrades also mean that we have to redo our calibrations, which will take even more time away. Fingers crossed, however, that after its return we’ll be back more efficient than ever!
That said, considering that the continued operation of the Mouse over the last years has largely been a two-person job, I am extremely pleased with the amazing performance we have been able to get from this – now highly modified – measuring marvel.
Leave a Reply