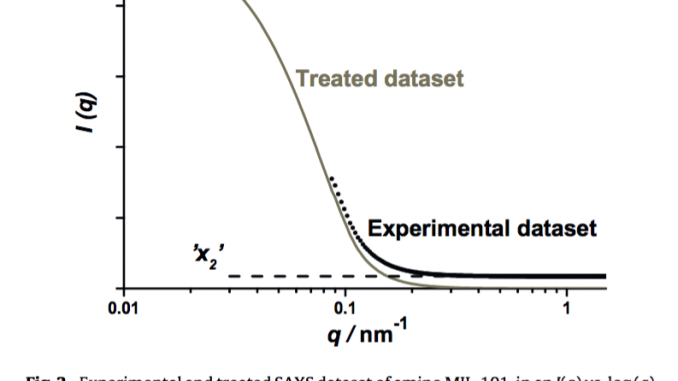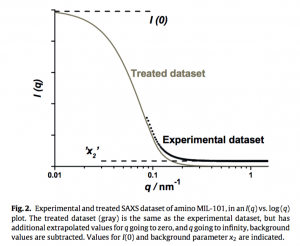
I never knew the stress at the end of a year could be this high (application forms to fill in, articles being submitted, five projects to juggle, etc.). However, I did not want to leave you without this example of how not to do SAXS (Figure 1).

In brief: in this paper, the authors extrapolated their few datapoints of SAXS data, adding another decade, and then analysed that curve to get some data out. Yes, they also looked at the Guinier radius.
Now, I can understand how they got there: they read a few papers about SAXS, and saw that it is possible to extrapolate your data to q=0*. They then read about the basic analyses you can perform, and applied those to the extrapolated data. Without experience, this is what you may somehow end up with.
For us, this offers a good insight in the thought processes of the novice user, and it is something we should consider when teaching. We need to be very clear about the standard procedure to follow when analyzing data. Suggestions for preventing this in the future are more than welcome.
*) extrapolation is risky but possible, if you know that your sample doesn’t contain large structures, and if you have enough information in your scattering data to extrapolate flatly, can demonstrate this validity using a Kratky plot, and only to determine the invariant. When you’re measuring on absolute scale, however, which is not hard to do, you don’t need to extrapolate.

The most relevant question: Why did the referees accepted this paper with a graph like this?
Happy publishing.
Because the pre-publication peer-review system is a broken, archaic system, ill suited to deal with the deluge of papers. In the best case here, it’s because the reviewers were overloaded or equally not familiar with SAXS. In the worst case, it’s because the reviewers were friends of the authors and had academic debts to pay.