

We’re experimenting with new ways of managing our datafiles, and frankly, the old, ubiquitous paper logbooks are just not cutting it for that. Previously, we’ve tried using single YAML files for this, but they are not particularly good from a user perspective. So it’s time to try something else.
We’ve been prototyping the conversion of our raw SAXS data to the NeXus format, so that it may be used as in input file in DAWN (apropos, the 2.6 version with many bugfixes has just been released). DAWN can do most of the corrections we need using the metadata stored within the NeXus files.
Some of this metadata is not directly available, and so it needs to be manually added. Much of this was already written down in our logbooks in the original working procedure, but filling it in twice (once on paper, once on a computer) really makes you feel like you’re wasting time.
So out with the paper logbooks, and the single YAML files, and in with [drumroll]: Excel. Or rather: the free OpenOffice Calc. Now I know what you are thinking:
- That’s horrible!
- You cannot open an excel file with multiple users!
- I don’t want to end up with a “Yuge” excel file in a few months, and then it gets accidentally deleted and I’ve got nothing!
Ok, I get it: visions of horror. However, there are also advantages that are to our benefit.
- Everyone is familiar with its horrors.
- It’s the same as a paper logbook, only one person can open it at a time. Isn’t that enough for initial entry / primary input, though?
- We use one file per month. Old files can be locked, printed, put in a three-ring binder, stamped, signed, holed, embossed, gilded, etc. Normal back-up rules apply to prevent data loss
- We can read in the file using standard Python Pandas methods
- It is — sort of — a GUI, allowing you to easily make series and copy-paste from previous experiments. Speed of operation is very high. Training is minimal to nonexistent.
- Data types for columns can be predefined, making sure that the input data for your data processing is of the right type.
So for the lazy or time-constrained stressed-out Brian, this may do for now. We started with columns inspired by our YAML-file entries, but over the last months, we’ve been refining the columns a little to help with processing. It’s not pretty, but it looks like this for September in its full width:
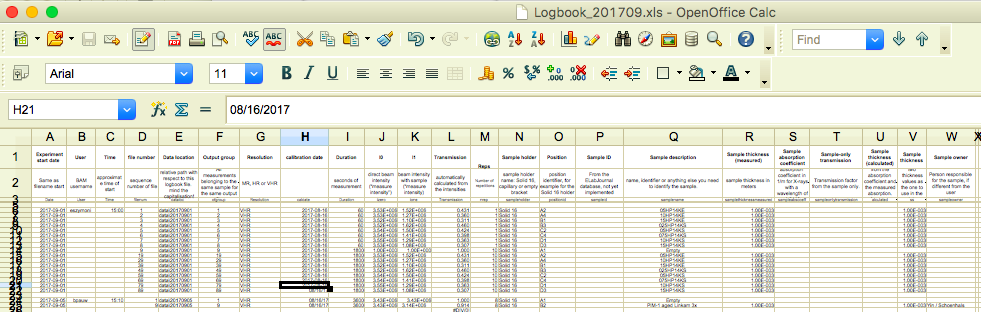
I know, not much to see. The columns we have are:
- Experiment start date: each measurement day’s files are put in a separate directory
- User
- Time
- File number: the raw files are sequentially numbered from the instrument
- Data location: this one’s superfluous, can be derived from the date, will likely disappear soon
- Output group: all measurements that are to be packed into the same NeXus file should be assigned the same group number. The final output filename will carry this number
- Resolution: The collimation configuration setting
- Calibration date: This information is used to fish out the associated calibration data
- Duration: exposure time in seconds
- I0: direct-beam intensity
- I1: transmitted-beam intensity
- Transmission: automatically calculated to serve as a quick cross-check for the user
- Reps: number of repetitions of the exposure. These are automatically packed together in the output NeXus file
- Sample holder: identifier for the sample holder used
- Position: position on the sample holder or sample grid
- Sample ID: To be linked with our separate sample database in the future
- Sample description: a note by the user of what they’ve stuck in there. Should come from the sample database in the future
- Sample thickness (measured): in meters, naturally!
- Sample absorption coefficient: One of the parameters needed to calculate the thickness from the absorption
- Sample-only transmission: transmission factor of the sample phase only (i.e. without the container window attenuation).
- Sample thickness (calculated): uses the values in 19 and 20 to calculate the thickness
- Sample owner: who’s going to cry (out) if the sample is lost? This should come from the sample database in the future.
As you see, there’s everything that was on paper, and a bit more in there as well. However, this is as little as we can get away with, and we need most of this information later on for our data corrections. Writing this down at the time of the experiment will save you so many headaches in the future.
We’re also storing a lot of metadata that’s not in this document, but that comes straight from the instrument. These are, for example, motor positions, environmental readouts, generator settings, detector properties, rotations, etc.
It is a lot of info, but it allows us to do quite a bit later on.. But that’s a story for next time…
Why not using Google Sheets instead of Excel? This would allow multiple users working on one document at the same time as well as commenting on cells, sharing them as links, etc.
Good question. In the next step, I am reading in the excel file in Python to extract the metadata for each measurement, so I need to have the file available locally. Also, our European government institute explicitly forbids us from using US-based people-farming services ;).
Cheers,
Brian.
How do you measure your I0 and I_trans? Have you got some sort of beam monitor that continually measures I0 during a measurement?
We determine these before the measurement start using the image detector itself. This, combined with information on the beam intensity stability gives us an estimate with uncertainties of the transmission.
We’re investigating alternative beam monitors that can monitor during the measurement without introducing additional scattering.
I may have to contact you off list about this. I’m starting to look into the same thing.
ok
Excel. Indeed, this does not looks very appealing. Do you know about ELOG (https://midas.psi.ch/elog/)? I have used is for 6 years of experiment at PSI and it did its works. It can easily be backed up, one entry per measurement with a pre-defined table is an easy task, it is free, automation could load some parameters automatically, searching, filtering, serve access by user (read only or read/write)…