

After you’ve taken the pains to fill in a decent logbook (see last post), you can use it to give your raw scattering data much more value. Here’s an example of this for one of our temporary instruments.
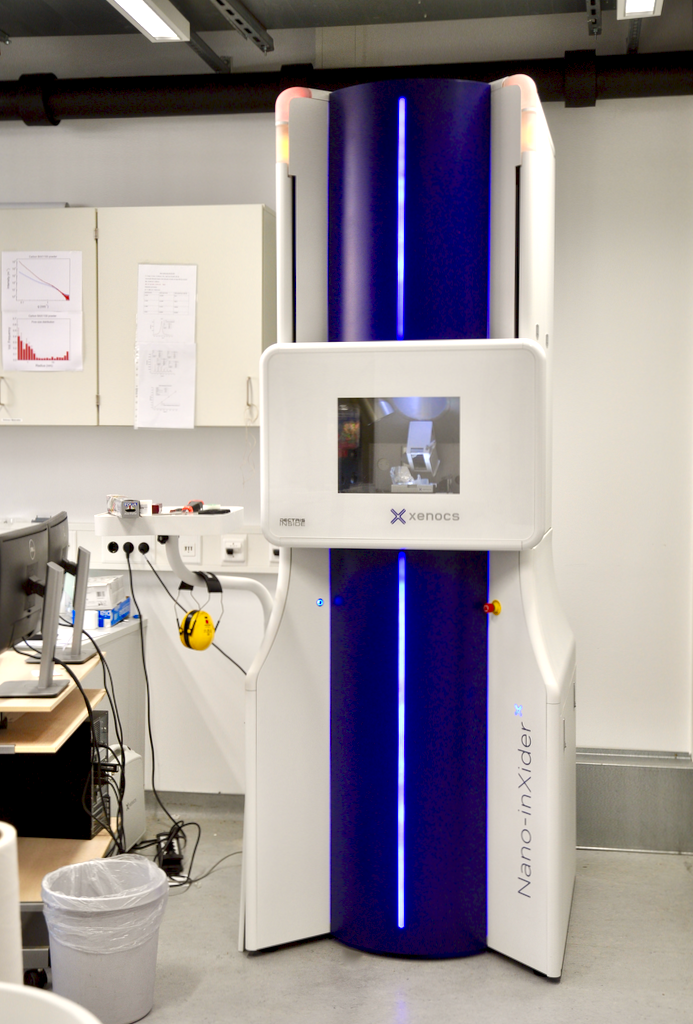
The instrument used for this example is an instrument we could rent, until our new, all-singing, all-dancing instrument arrives (remember this story?). This rental is one of their vertical pinhole-collimated machines, equipped with a fixed SAXS and a WAXS detector, producing EDF files from the raw detector images. When I do multiple measurements on one sample (repeats, position-, or time-dependent measurement sets), these multiple images, initially stored as many EDF files, are collated into a single file in the universal NeXus format. One experiment, one file. By the way, this NeXus is still a “raw” file, this data has not undergone any of our corrections yet.
EDF (ESRF Data Format) files are, as the name suggests, the files of choice for the ESRF. They are mixed ASCII/Binary files, containing a header of arbitrary size, and one or more data blocks (images). If my understanding is correct, the header contains more or fewer keyword-value pairs and separated or bunched images depending on the mood of the beamline programmer. The keyword-value pairs might also not be consistent between beamlines for the same information bit, and are not (hierarchically) organized, making it hard to discover groupings and correlated parameters. It is also hard to find out in this way which parameters were ideally constant, and which were actively changed or driven during the experiment. Anyway, time for a change.
To demonstrate the power of NeXus, I’ve recorded a set of 38 frames on the two Pilatus modules with different exposure times, ranging (stepwise) from 0.1 to 3600 seconds. We can use the wonderful fabIO package from Jerome Kieffer (ESRF) and colleagues, to read in the EDF files without having to research too deeply into e.g. endianness and data types. It also helpfully extracts the header into a Python dictionary, so we can easily read the information we already have. The information we don’t have comes from the logbook from the last post. As mentioned, we have two detectors, and a whole host of instrument parameters we can also pack into the one file together with the logbook information using a simple Python script. What that resulting file contains is shown in Figure 1 (screenshot from DAWN).
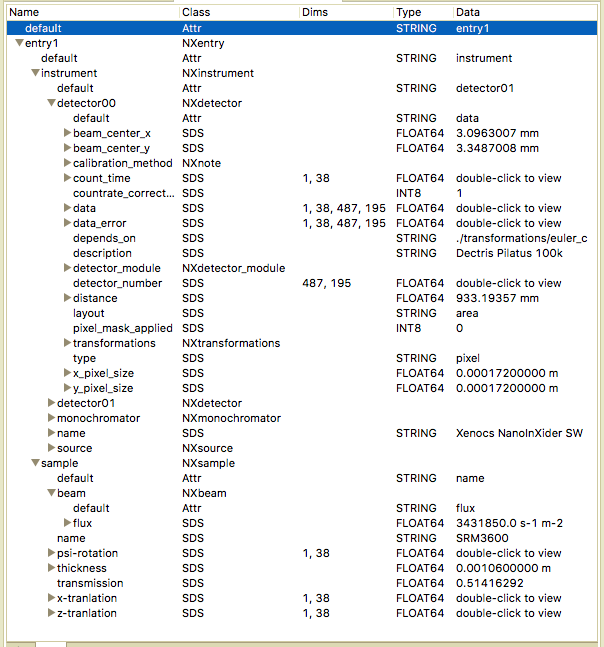
I have expanded some of the groups so that you can appreciate the details in the structure a little better. Without knowing about SAXS in particular, the structure itself already tells you about the experiment: a sample and an instrument, itself consisting of a source, monochromator and two detectors (the collimation is not in here yet). For each of the detectors, I have information on the specifics such as its exact position and orientation, sizes, beam positions, calibration methods, as well as the data it collected. If I would happen to lose my logbook, or move this file to the Himalayas, I still have all information I need to interpret this file, and a structure to understand what was done. NeXus provides a universal structure and set of keywords that are so flexible that I can describe an entire experiment in one of these files, and one that anyone else can understand too.
Of note is the size of the data blocks: 1 by 38 frames of 487-by-195 images each. Imagine, for example, that you want to map your sample by measuring in different spots in x and y, collecting such image stacks for each spot. In that case, the format allows you to store this in a five-dimensional image array: x-by-y-by-time-by-image. The count_time and position arrays would then match the x-by-y-by-time format, and programs as DAWN can understand this and plot this in a nice graphic.
In summary, we can produce these very nice, detailed datafiles in practice, simultaneously exploiting the electronic logbook. These experiment files contain the data necessary to do the corrections, and are very suitable for archiving as they describe the entire experiment set-up, configuration, and variables through their structure. Now that we have gained some experience with this, we will be able to set this up quickly for the new instrument when it arrives (which should be running in time for Christmas/Saturnalia!).
Leave a Reply