

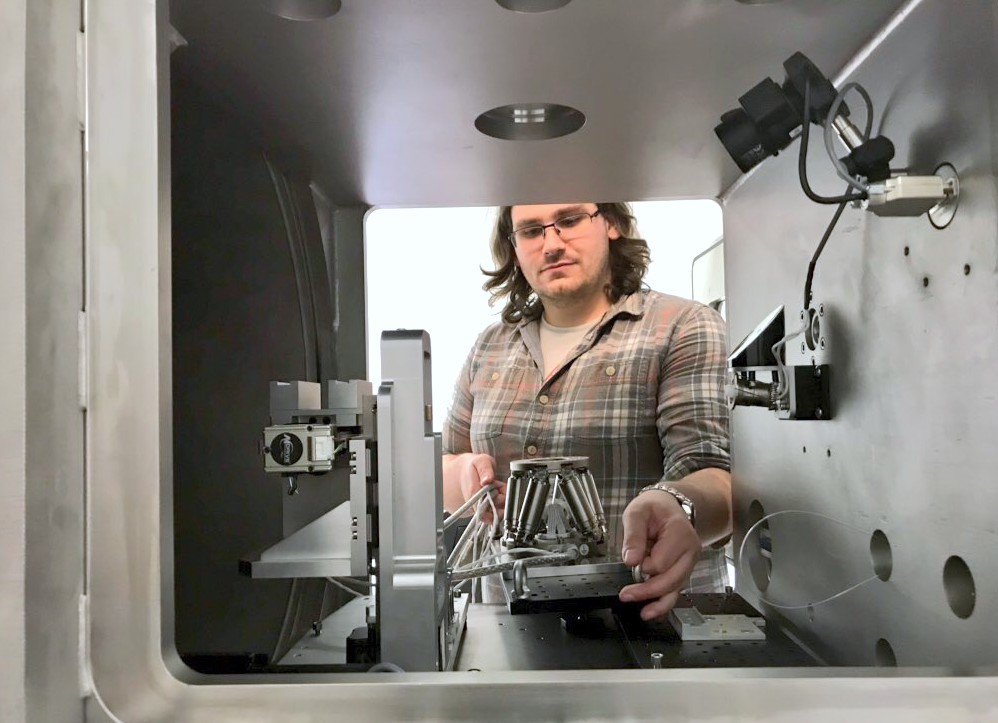
We’ve had the MAUS now for about a year, and it’s been working for most of that. Secondly, Dr. Glen Smales has now joined us, whose mission it is to keep the machine well fed and happy. This means not only measuring samples for ourselves, but also opening it up to the wider (internal and external) community.
Since we don’t have the luxury of an organizational system like the synchrotrons do, Glen’s first task consisted of setting a similar thing up for organizing these external users and uses, using nothing but the tools available already (which turns out to be mostly clever use of Excel). This has been well-maintained since his arrival, and so we can provide some statistics on the usage in of the MAUS!
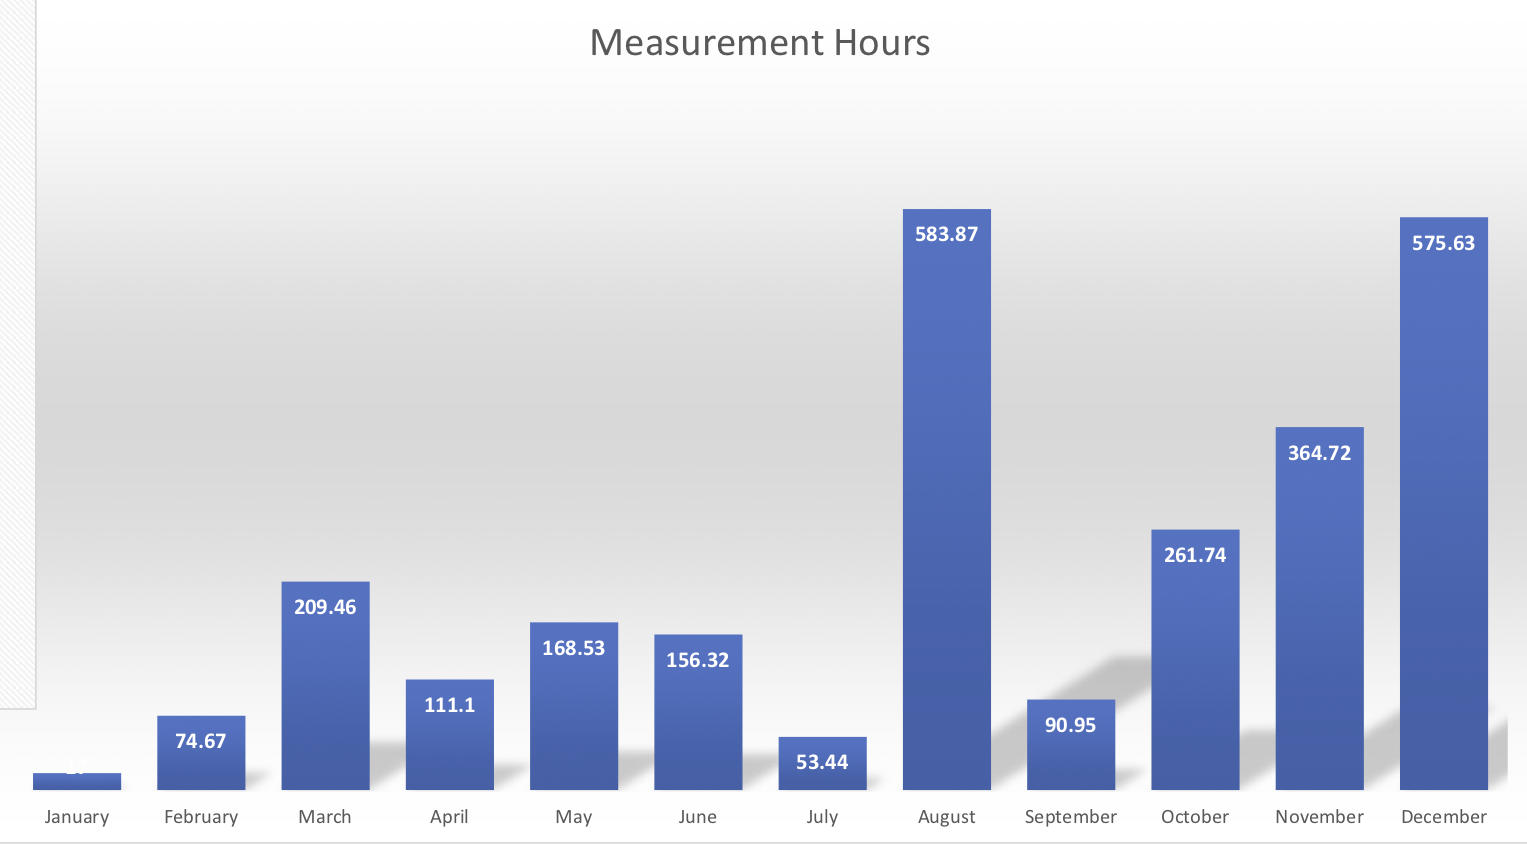
The MAUS has been measuring in 2018 for 2667 hours in total (corresponding to 111 full days). That’s not bad, considering it’s our first year, during which we also had to set up most of the logbook-keeping methods and fine-tune the measurement scripts. It also does not include any of the time around a measurement, such as sample mounting, instrument reconfiguration and sample preparation times. The per-month graph shows a big variation between months, which is strongly linked to the presence or absence of Glen.
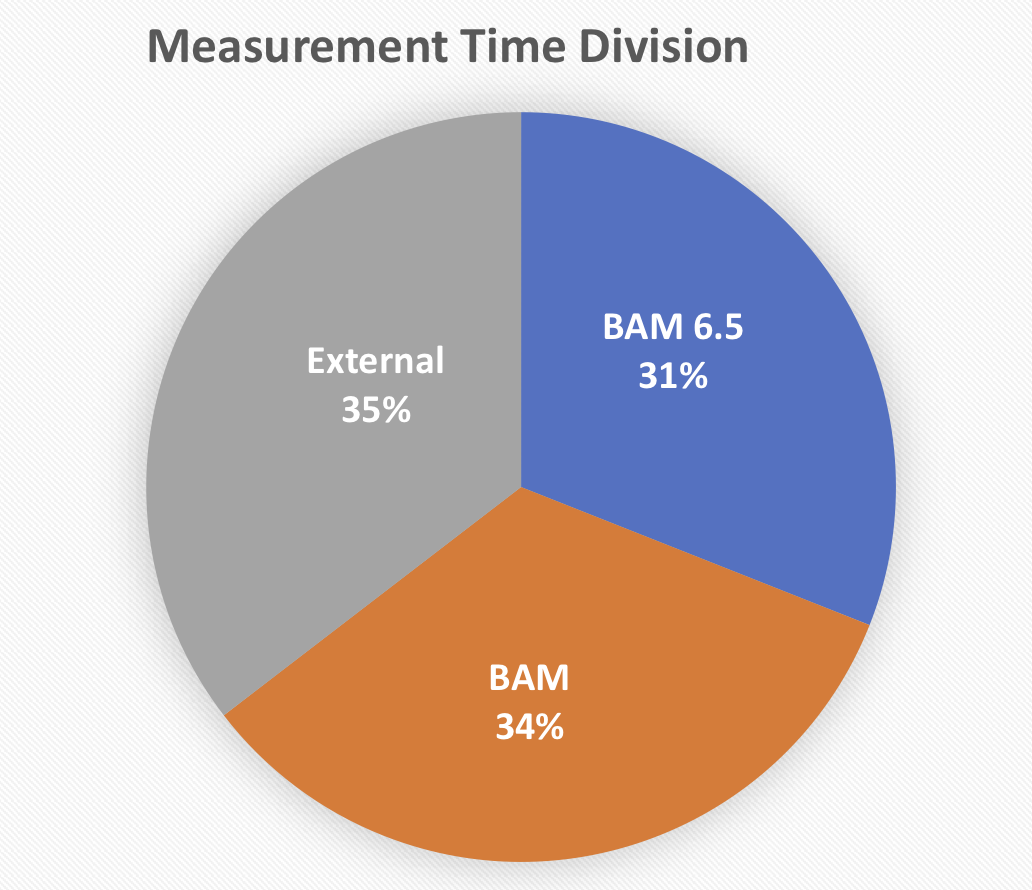
We can see that the MAUS has been measuring for our group for about 30% of the time, with 35% of the time spent measuring for the 11 BAM users from other groups, and the remaining 35% of time for 14 non-BAM-external users. That’s a surprising, but very apt division of time, and a nice goal for 2019.
During 2018, we completed the measurements for 75% of proposals, with the remaining 25% being carried over to this year. From the measurements, four papers have been submitted so far, and one has already been published (with several more papers in various stages of preparation).
The average measurement time per proposal was about 90 hours, but this is a very poor measure, as the times have been as short as 1 hour and as long as 714 hours (most of which was measured in a single measurement over the Christmas holiday). The published paper took 14 hours of measurement time, more details on the average amount of measurement time required per paper will be provided at the end of 2019.
Of course, there has been a great deal more work involved than just this that is not so well documented: for every submitted proposal, significant sums of time are spent communicating (by e-mail or in person) with the potential users, correcting and analyzing the obtained data, and simply thinking about the meaning of the collected data. These steps are usually much more time-consuming than the mere measurement. Therefore, they who use the above metrics to define anything of worth would be fooling themselves. Nevertheless, it does offer a nice glimpse into this segment of our working lives. Thanks to Glen for keeping score and keeping the machine running, allowing us to make this nice evaluation.
Lastly, if you would like to measure your samples using the MAUS, and/or ask us for advice or help, please feel free to contact us. More details on the collaboration options can be found here.
Leave a Reply