

A little later than planned, but just like we did last year: here’s some stats on how Glen and I have occupied the MAUS instrument with all your samples. We do not actively collect these statistics, but they are a by-product of the measurement organization methodology and provide interesting insights, so once a year, Glen flexes his Excel-graphmaking muscles, and visualizes a bit of a summary.
Last year was in incredibly productive year, with over 20k individual repetitions being measured on 300+ samples (every full sample measurement consists of a few sets of repetitions over a number of configurations). That made it a significant increase over 2018, largely due to improvements in working efficiency: by 2019, most of the automatic measurement scripting started to work as advertised. The average time per sample has largely stayed the same at 11h (note that calibrations and backgrounds are not included in the number of unique samples, so this time per sample is considerably overestimated).
| 2018 | 2019 | 2020* | |
| Users | 31 | 46 | 31 |
| Unique Samples (no backgrounds) | 252 | 329 | 184 |
| Reps (single measurements) | 8790 | 20517 | 10834 |
| Proposals | 38 | 49 | 35 |
| Hours per sample (unique) | 11.02 | 11.017 | N/A |
2019 was also the second year in which the MAUS was operational, so publications are starting to roll out of our use of it. The Google Scholar profile of the instrument nicely summarizes the broad range of research it has contributed to. Its H-index so far is 3.
Just to recap: when we operate this instrument to help internal or external materials scientists (and maybe you) to add X-ray scattering to their investigations, we guide the scientists through the entire process. That means we sit down for discussions on sample selection and ideal sample preparation, design the experiments and perform the measurements, then process the data and (in most cases) also fit and interpret the results within the framework of the research. Our goal here is to improve our understanding of the applications of the technique, to test the measurement methodology on a wide range of samples, and to find bespoke methods (where necessary) for the analysis and interpretation. The interpretation of measurements is by far the most time consuming aspect, but is not reflected in any statistic…
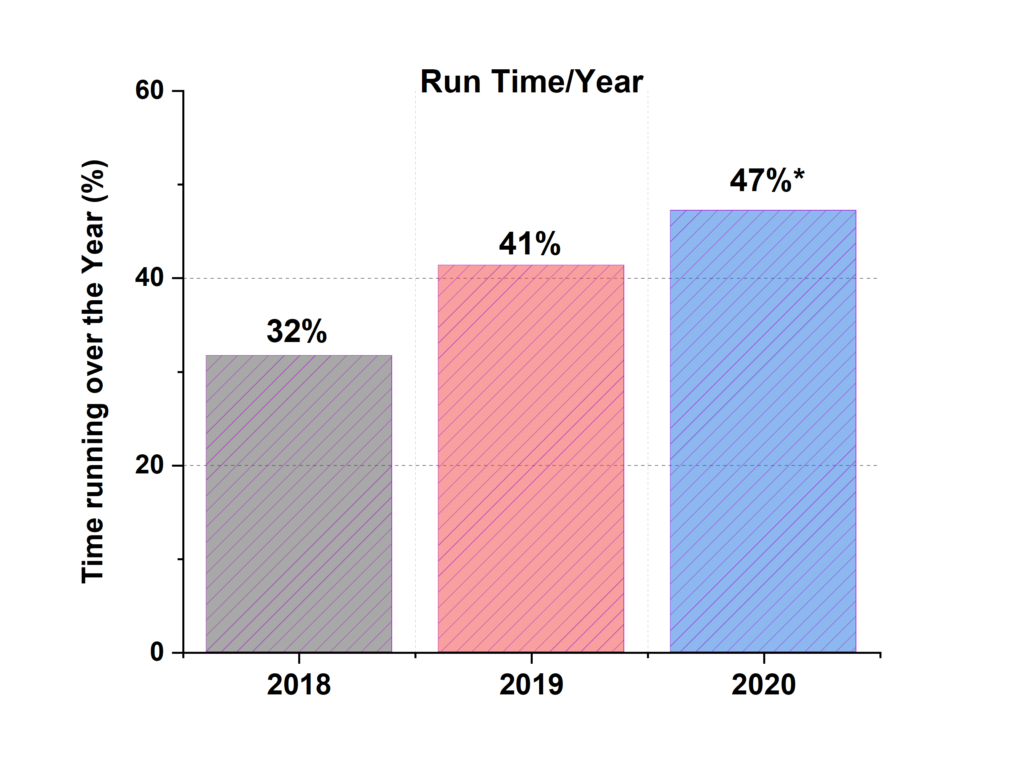
Our goal is not to maximize measurement hours or any of the statistics here, they are only provided to shed some light on what a few people and one machine can do. So far, we are reaching a utility fraction of about 40%, meaning that the instrument is actually measuring for about 40% of the time. Outside of that, there is sample preparation, sample alignment, machine reconfigurations (from liquid to powder, for example) and, of course, the occasional day that we do not have a batch of samples ready to measure, when we have a workshop to host, during holidays, or when there is the occasional hardware or software problem.
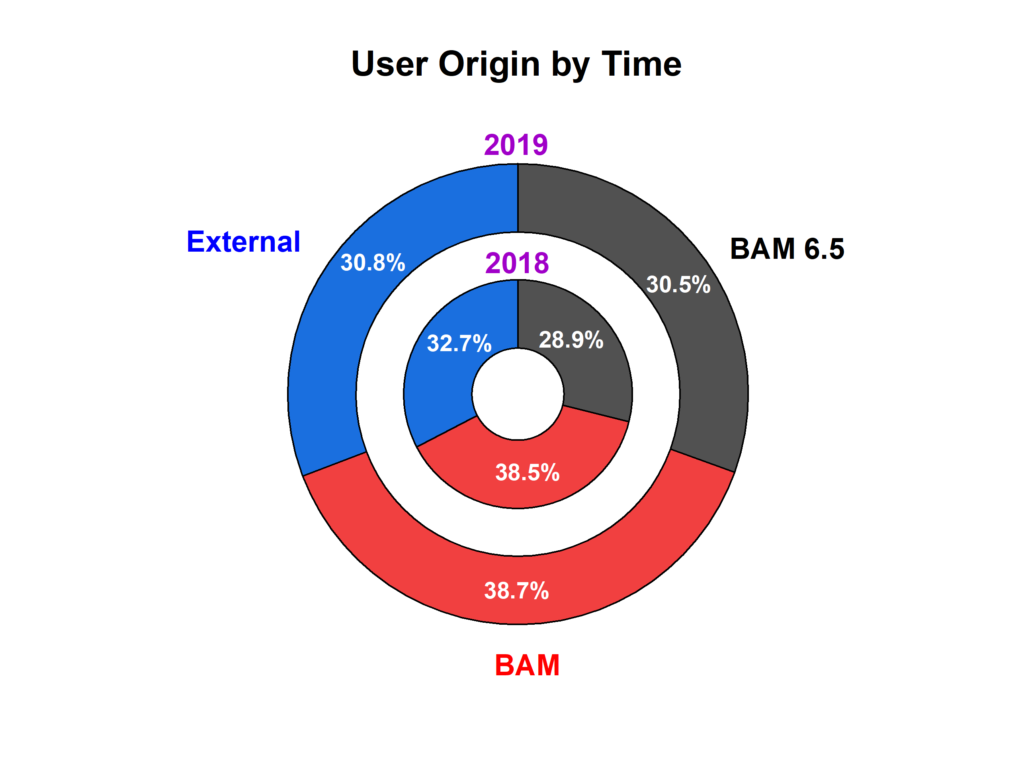
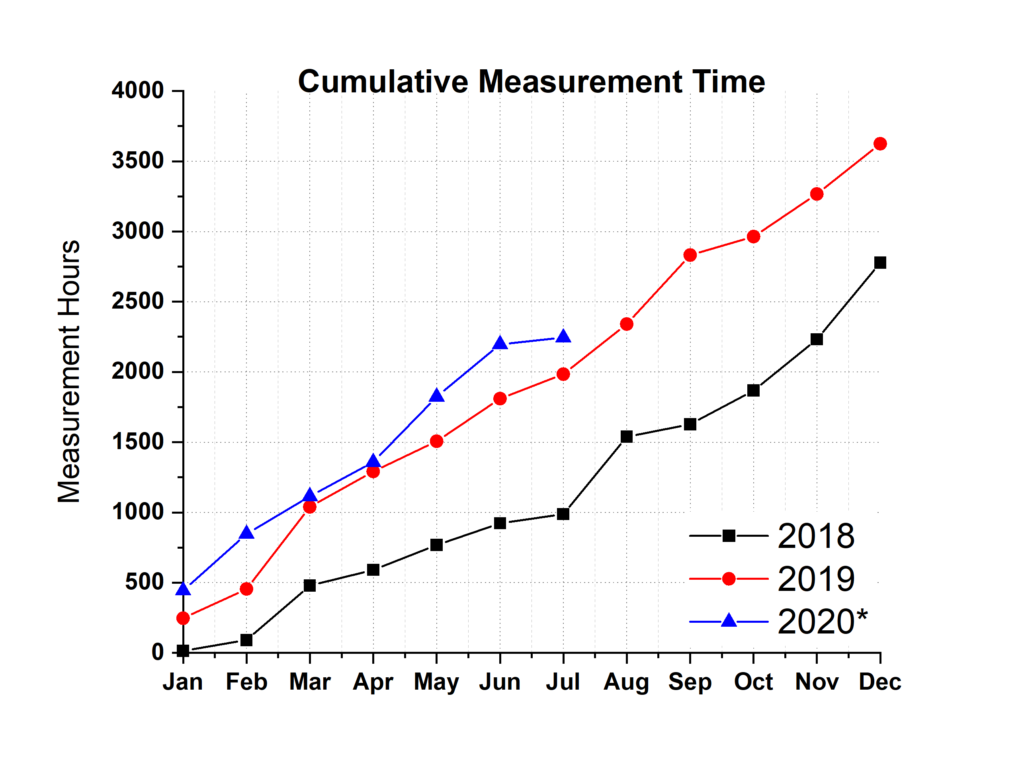
After some more improvements to the data processing workflow, this year is looking already very nice, with the measurement hours slightly above that of 2019. Despite this being a very unconventional pandemic-year, the samples kept coming from a wide range of users. As usual, there is always a good division between the different sample sources, and when we plot it by measurement time, we get our favorite 1/3rd split: measurement hours for our own group, measurement hours for other BAM groups, and measurement hours for our collaborative projects with external researchers.
Leave a Reply