Abstract of this post: In this post, I will show that for a spherical two-particle system, the observability of the smaller particle scales with the inverse squared radius, quite different from the scattering power, which scales with the radius to the sixth power (volume squared). This means that scattering data with 1% error can be used to distinguish at most particles 1/20th the size of the largest particle present, and data with 0.1% error can be used to observe single particles at most 1/50th of the size of the largest particle. Beyond this, only proportional numbers of smaller particles can be observed. Additionally the point of maximum observability is determined to be at q*Rg~2.6 for numeric examples, and q*Rg~2.45 for an algebraic approximation.
Last time I promised to try to elucidate what all the accuracy- and statistics-hunting of the previous posts is needed for. Indeed, this particular question popped up one day when discussing monte-carlo size distribution retrieval methods. As we all know, the scattering power of particles scales with their volume squared, which would mean that small particles are practically invisible over the scattering of large particles. However, the scattering pattern itself is also dependent on size, with large particles exhibiting a q^-4 slope, while small particles in their Guinier region decays much less steeply (c.f. this short document).
So the question was raised: “to what degree can we distinguish small particles underneath scattering from large particles?”. Which is where we set off. This post will discuss only the case of two isolated particles. The future will hopefully allow me some time to investigate whether it is significantly different for polydisperse systems. If you have figured out the answer to this question already, please raise your voice.
So we consider two particles in a scattering system. We define the observability as the largest fraction of the total scattering intensity from the smaller component. Thus, this observability is directly tied to the statistical accuracy of your data: if the observability is 0.01, you need a data error of less than 1% before you can show its existence. If this sounds a little unclear, I hope it will become more clear in a moment.
While we should use the scattering from two normal spheres for this, the oscillations in the sphere scattering pattern would result in an unclear answer. What we will use instead is the averaged sphere scattering function, as described by G. Beaucage here, which in “Matlab-ian” would come down to:
G=NRePe.*2000.*pi.^2./243.*Rg^6;
B=NRePe.*40.*pi^2.*Rg.^2./3;
I=G.*exp(-q.^2.*Rg.^2./3)+B.*((erf(q.*Rg./sqrt(6))).^3./q).^P+noise;
Where NRePe is a constant (composite of the number of particles, the radius of the electron and the electron density contrast), Rg is the radius of gyration, q the scattering vector, P the Porod law exponent (fixed to -4) and noise is a flat background contribution term, set to zero for this derivation.
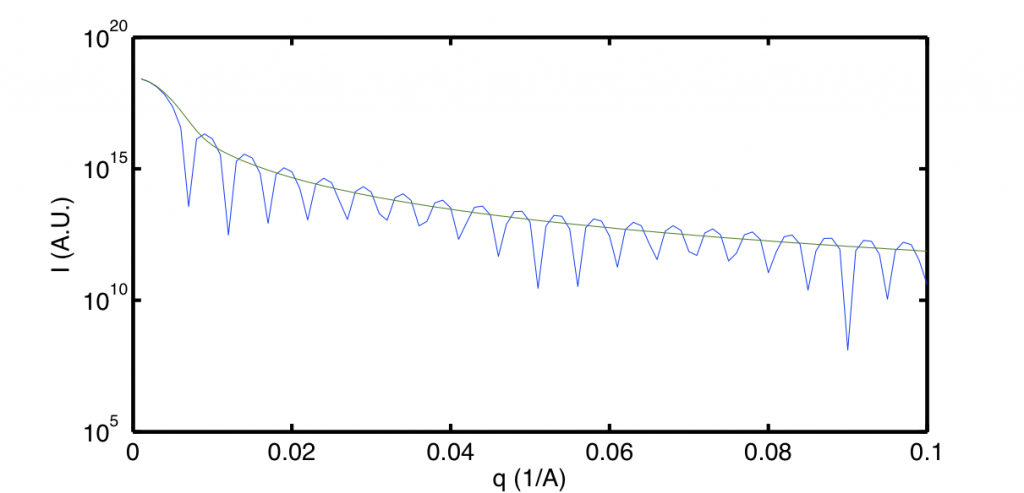
For a sphere with a radius of gyration of 500 ångström it is shown compared to the Rayleigh sphere scattering function in Figure 1.

It appears from this figure and other figures of the scattering of spheres of other sizes, that the average scattering function may serve as a good approximation to the sphere scattering function for the purpose of determining the observability.
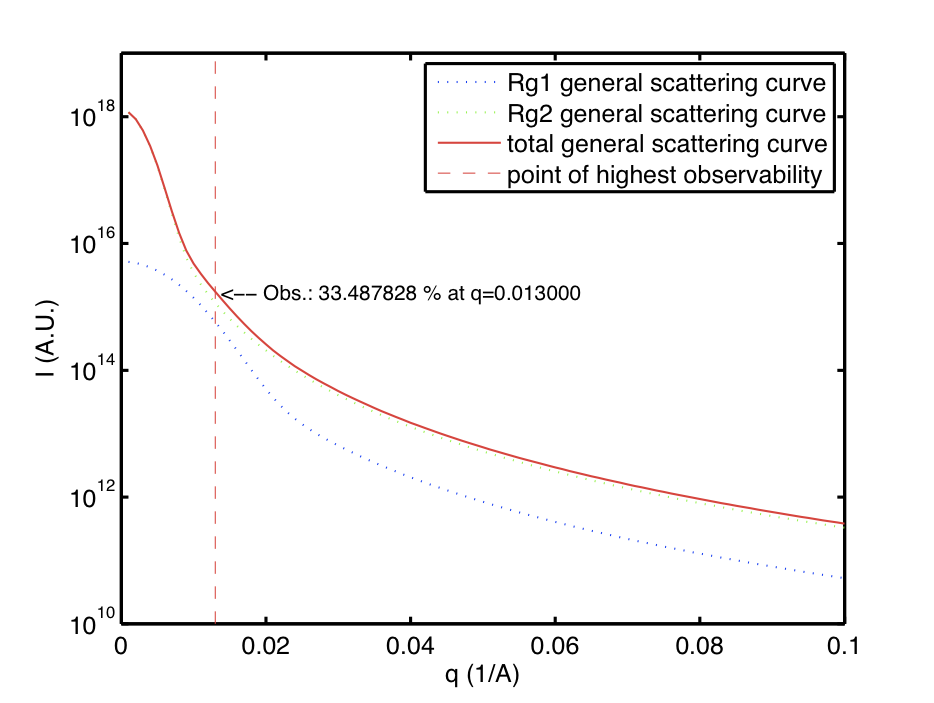
When we try to determine the observability of a sphere with a radius of gyration of 200 underneath the scattering of a sphere of 500 ångström, just by finding the point where the contribution is largest for a given set of q, we find the observability to be 34 % at a q of 0.013 A^-1 (Figure 2).

This value tells us that the observability certainly does not scale with the volume squared, as then the observability would be less than a percent (200^6/(200^6+500^6)). Also we can see that the shape of the scattering curve certainly plays a strong role in the observability.
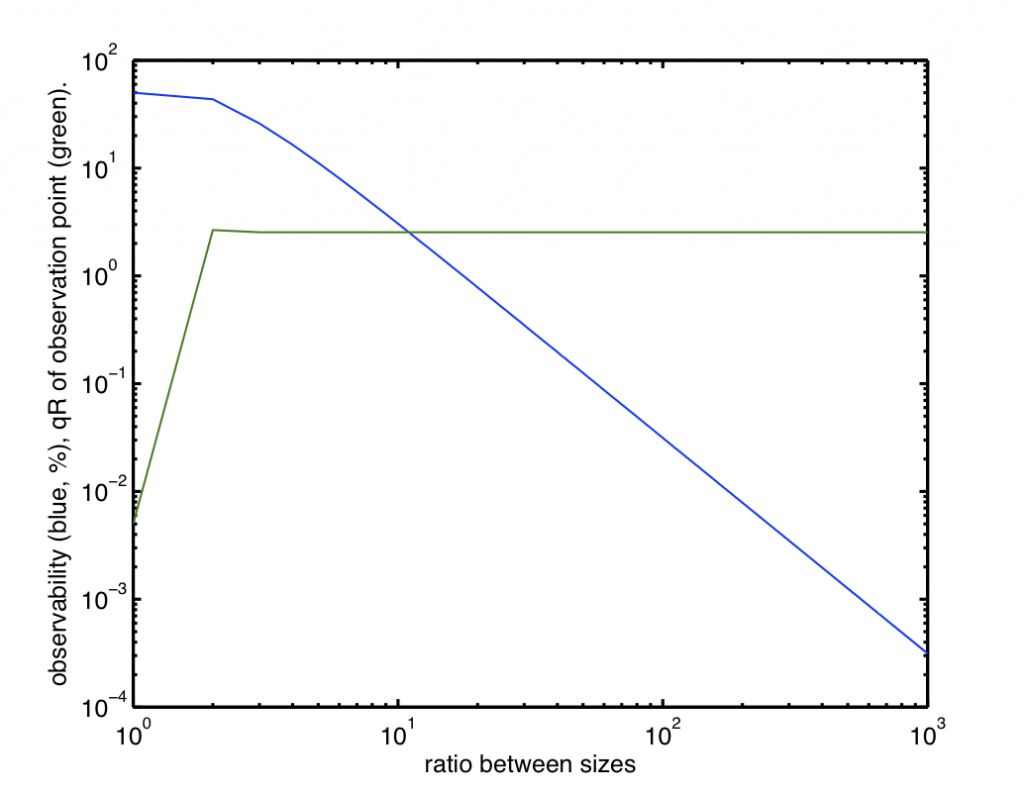
We can now run this same test for many different sizes of small spheres, to determine the observability as well as the q at which this observable point is located. Indeed, we know that the position must be related to the radius, so we plot both the observability as well as qR for a variety of sizes. This is shown in Figure 3.

There are two interesting aspects visible in this graph. Firstly, the observability (for two particles, mind you, which may not automatically be similar to polydisperse systems) scales with the inverse radius squared. Secondly, the position at which the particle is most observable appears to be constant at q*Rg~2.6.
Additionally, we can see that if our data in our scattering patterns have an error of 1%, we can observe single particles no smaller than 1/20th of the largest particle (of course, you can see multiple particles with smaller sizes, but there need to be proportionally more of them). If you have a very, very good scattering pattern with an error of 0.1%, you can distinguish single particles 1/50th the size of the largest particle.
This is the main point of the story, you need very good data for polydisperse systems to be able to distinguish the smaller particles above the scattering of large particles, but it is not quite as bad as the volume-squared relationship initially assumed.
It is interesting to note that the position of the maximum observability appears to be constant. This can also be derived using the help of Samuel Tardif and Mathematica. Assuming that the radius of gyration of the larger sphere is always much larger than the radius of gyration of the smaller sphere, we can simplify the average scattering equations, and indeed, a constant rolls out which is only slightly different from the result of the numerical experiment; Mathematica says that the point of maximum observability is at q*Rg=2.45. Why this is the case is beyond me, but it must be related to the curvatures of the scattering patterns.
Please feel free to leave a comment to let me know your thoughts on this. Initially I thought of publishing it, but it has just been gathering too much dust over the last couple of months.

Leave a Reply