

A while ago, we measured some modified alumina membranes for a colleague of ours, and we talked about it here. These membranes are thin alumina wafers containing an etched trigonal (P3) or hexagonal (P6) array of pores perpendicular to the surface. We decided to measure some more of these beyond the end of the project, because their scattering patterns are interesting and somewhat challenging. Combining the data from the different collimations here requires some care, as beam smearing at the less stringent collimations is much different than at the finest collimation. This means that for the combination, a significant portion of the low-Q region of the shorter distances is removed before merging the datasets to prevent beam smearing from playing a dominant role.
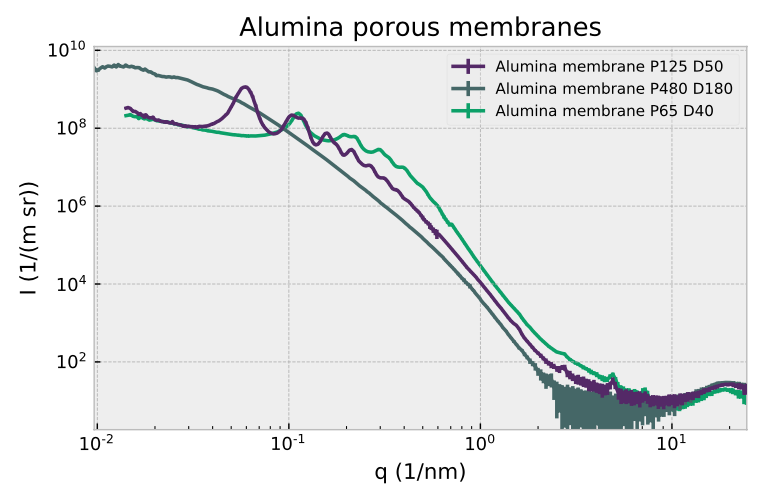
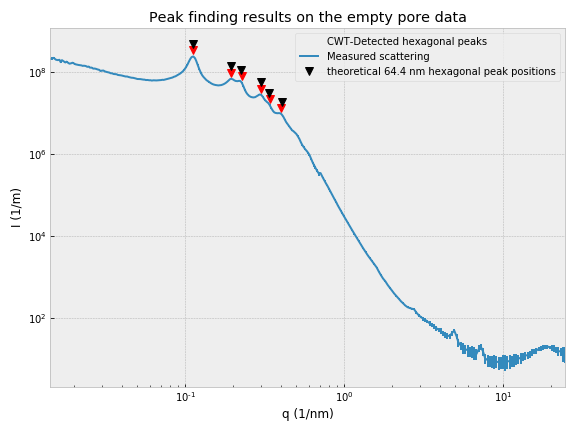
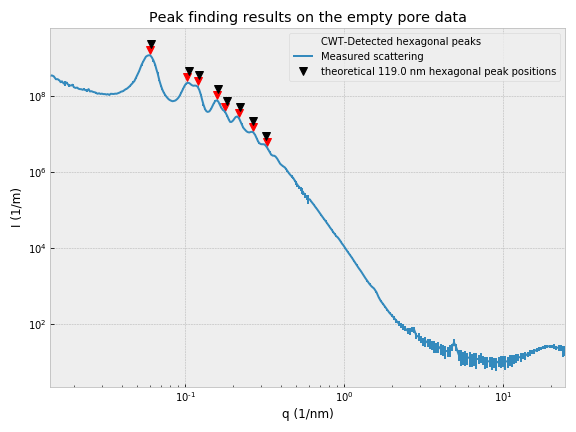
In total, we’ve measured around 18 such samples over the entire Q range, but it turns out we only had variants of three pitches, 65 nm, 120 nm and 450 nm. While the 65 and 120 nm pitches let themselves be measured and analyzed relatively easily (see Figures 2 and 3), you can see we are starting to get into trouble with the 450 nm sample (Figure 1). For this sample, the peaks are barely visible as very broad oscillations in the scattering pattern, which can be due to one or more of the following effects:
- Beam smearing, or folding of the diffraction with the size of the beam is affecting our measurements. While on the finer pitches the peaks are quite far out, the 450 nm pitch means its effect is very significant and needs to be taken into account for such highly regular structures, with feature dimensions on the scattering pattern approaching the beam dimensions.
- Size and coherence: 450 nm pitch, and 180 nm pore diameter is very large. To get a sharp diffraction pattern from this, the coherent portion of the beam entering the sample needs to be much larger than this, enveloping as many of these pores as possible. If only a few pores are illuminated by the same coherent region, the diffraction peak will broaden in the same way that limited crystallite size does in XRD, up to a point where it cannot be measured anymore. A rough estimate tells us that the transversal coherence length in the finest collimation is around 0.154e-9 * 1 / 0.09e-3 ≈ 1.7 µm. That would envelop about 10 or so cylinders, and would severely limit the sharpness of the diffraction we can see at all.
- Alignment: In this case, the sample was mounted in our standard solid holder. This does not give us the chance to put the membrane exactly perpendicular to the sample, and may be off by a degree or so (see our previous blog post on the topic). I am not sure, but this, too, could affect the sharpness of the features in the scattering pattern.
- Variation in the sample pattern: if the sample itself contains a less regular structure, the peaks will reduce in sharpness as well.
So, all in all, an interesting investigation that pushes the limits of the MAUS, and one that could — if investigated further — help us understand better what we can and cannot see in our scattering patterns. This is a good example where going to a beamline might be beneficial: at the beamline you have typically much smaller and much more parallel beams, further away from the source, leading to reduced beam smearing and increased coherence of the beam.
More in-depth analysis and fitting of this scattering pattern would be helpful to understand what effects can be accounted for in modeling. For now, it reinforces the idea that large dimensions are still hard with SAXS, and that you really could use a dedicated USAXS for large structures… More on that, hopefully, this year.
Leave a Reply