

It’s been almost five full years since we started keeping detailed operational statistics on our X-ray scattering machine. It’s also been a little more than five years since we started improving each aspect of the workflow, hardware and software, to holistically improve our work. That, in turn, resulted in drastically more samples measured better, and more papers rolling out the end of it. Check it out:
Before we start, I have to mention that 2022 is not quite finished yet. That means the statistics for 2022 aren’t complete, and the end result will be better than what’s shown here.
What did we do?
With a good team dynamic between the two of us running this lab, me and my hardworking colleague Glen Smales managed to gradually iron out workflow bottlenecks. Roughly speaking, I have been mostly at work on improving the backend and data processing workflow, whereas Glen has mostly worked on supporting the collaborators and improving the operational workflow. The aforementioned bottlenecks became apparent in one of two ways, either by Glen highlighting inefficiencies and coming up with possible fixes, or by me noticing that the data was getting stuck in the pipeline somewhere. We have also been greatly helped by Ingo Bressler, setting up and maintaining the computing backend and setting up the SciCat data catalogue, and Sofya Laskina, improving the data catalogue upload and processing.
Particular improvements I remember include the gradual growth and changes in our electronic logbook (an excel sheet per year) that gets read and converted to measurement scripts. With the workflow changing to support more automation as well as more exotic experiments, the logbook and scripting engine changed with it.
Secondly, I noticed early on that data wasn’t always making its way from the instrument computer to the networked storage server that holds the data. That bottleneck was due to USB sticks being a bit of a hassle: every time a manual step needs to be done, it’s at risk of not getting done – people are always in a rush. When a way presented itself to resolve this, that bottleneck was removed through automatic uploads. Likewise, manual batch-wise correcting of data in DAWN was replaced with automated, universal headless corrections as soon as possible. These haven’t let us down.
Another improvement was a big upgrade to our sample stage and sample holder, increasing capacity from 15 to 48 samples on a rack, or up to three flow-through capillaries.
These changes have not reduced our ability to run one-off fun experiments with USAXS, GISAXS, heated stages and flow-through monitoring though. It just means that the run-of-the-mill samples are less of a barrier.
Thing we don’t really do include “just a quick experiment to see if there’s something there”: might as well run a full measurement. We’re also no longer adjusting the measurement range to just what the researcher might think the sample will need, but instead we measure the full range for all of the samples: you never know what you will see!
Stats over the years
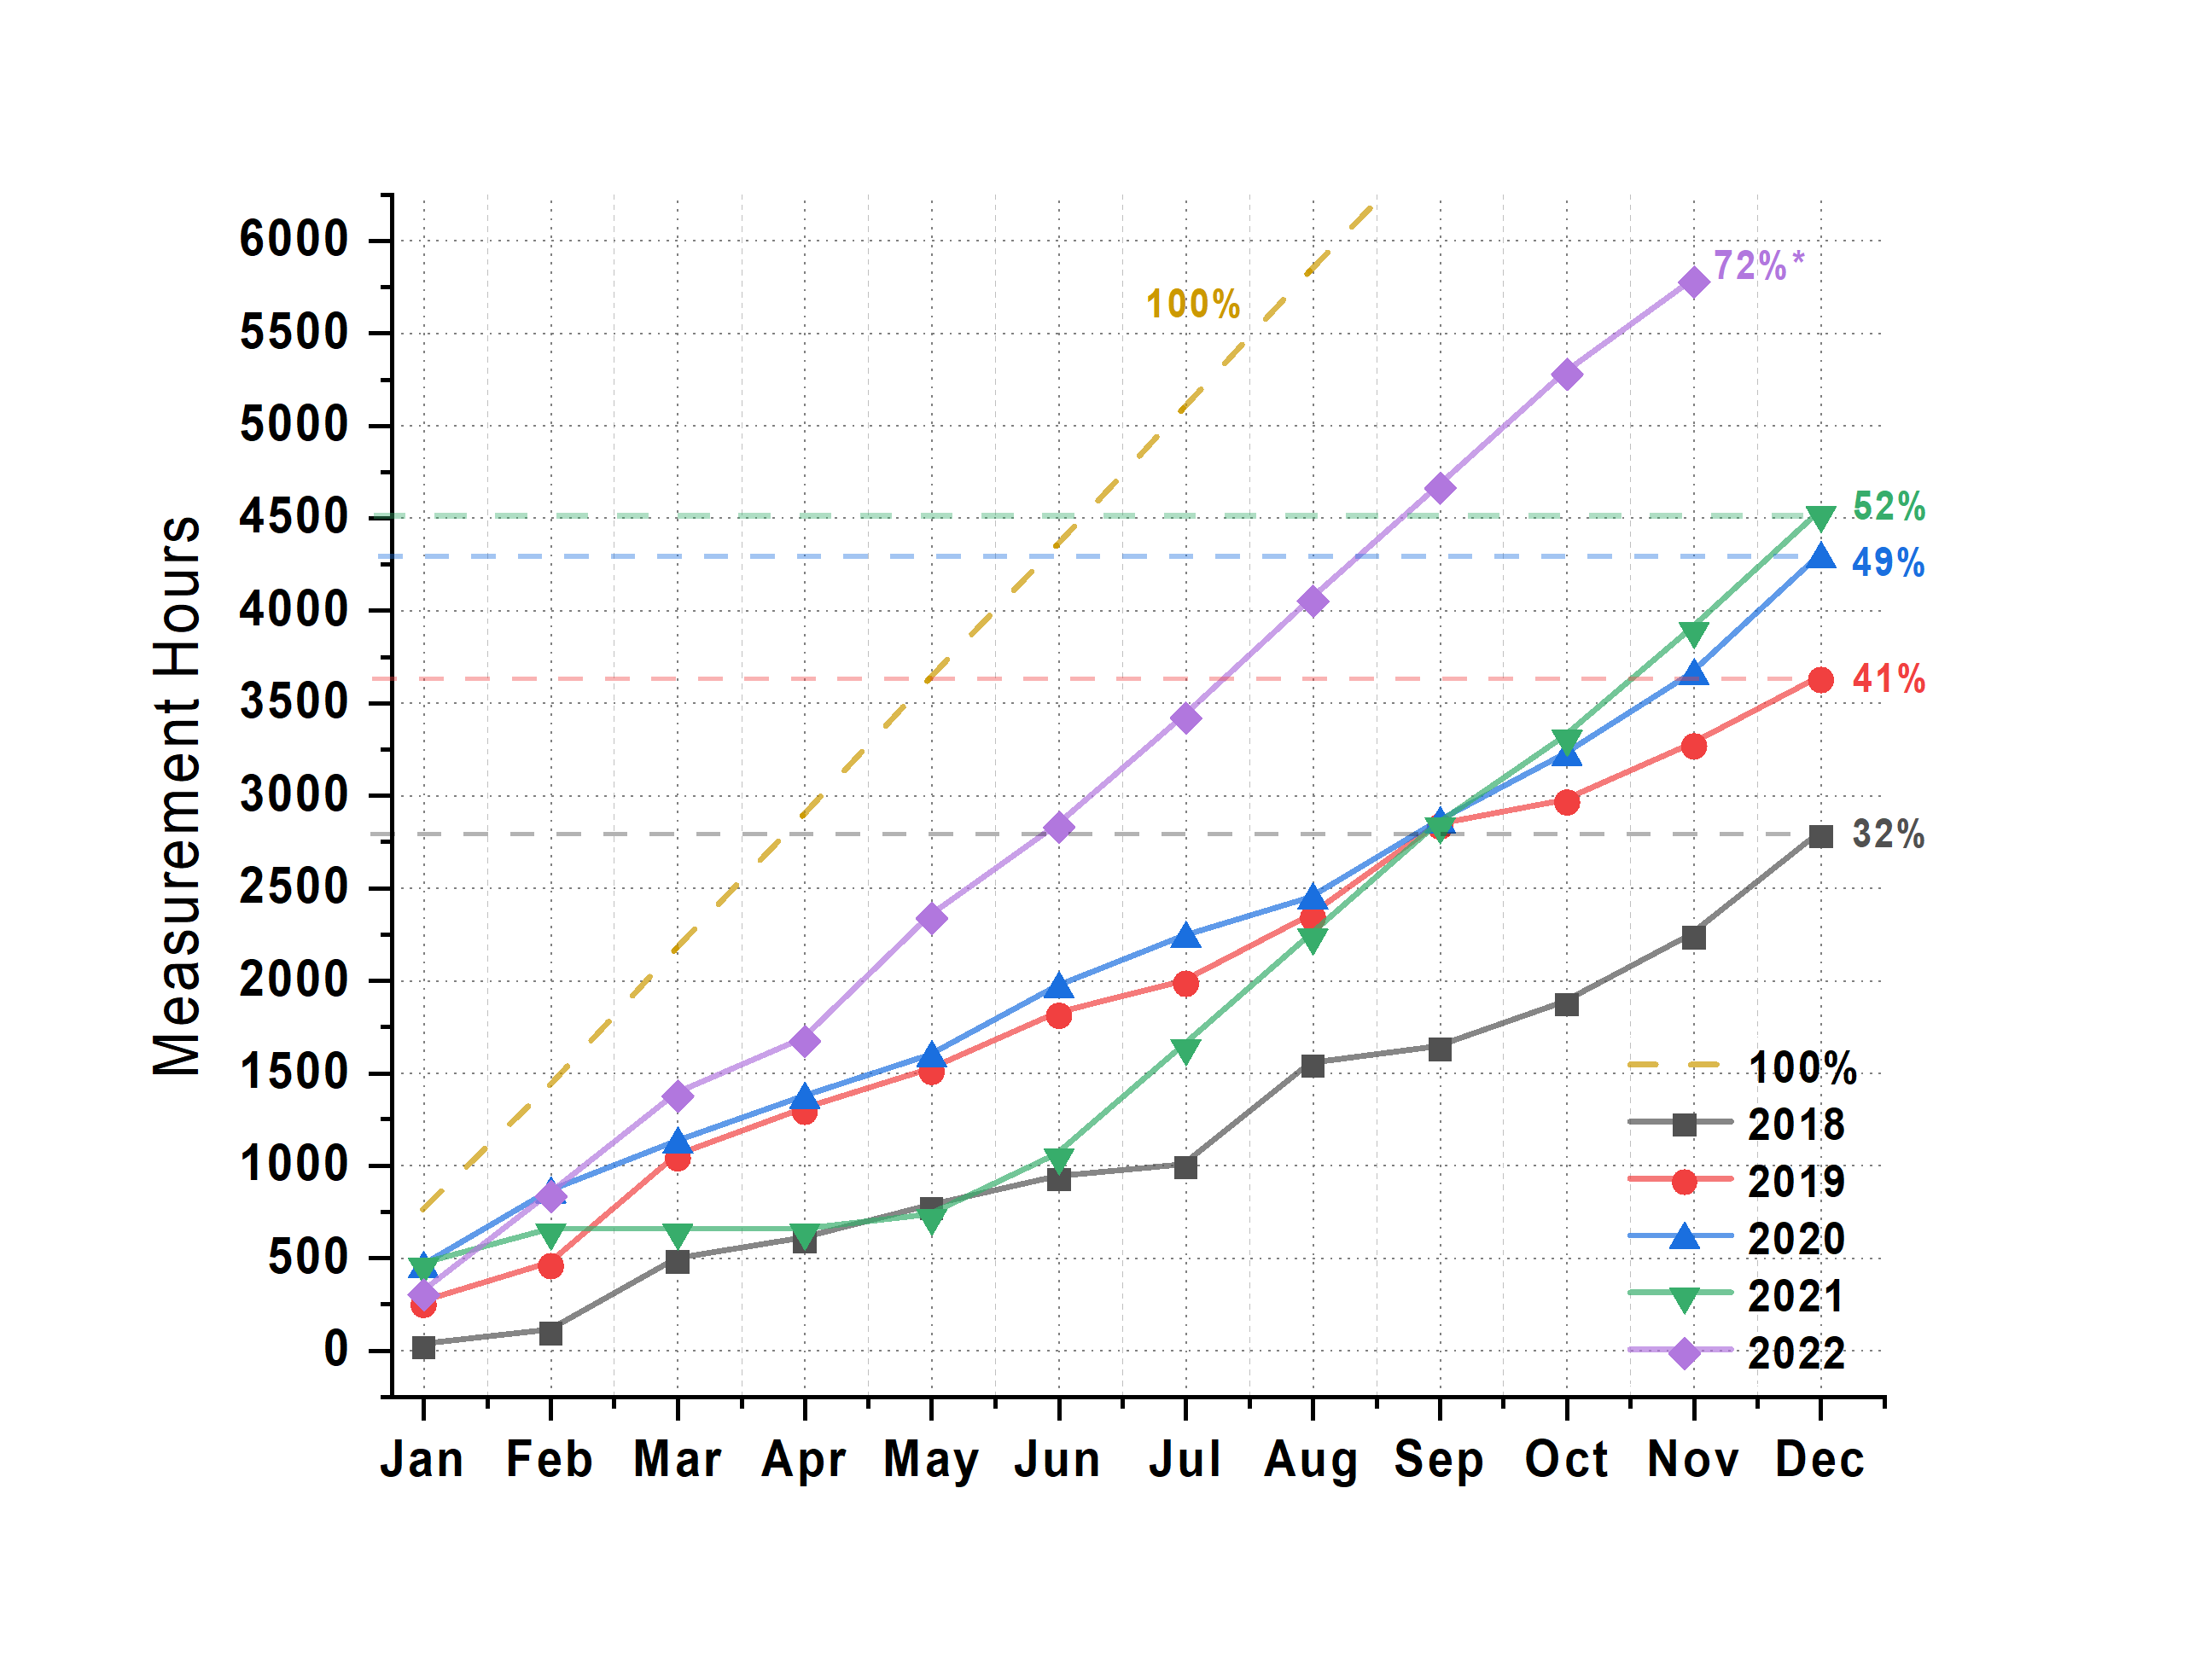
Time: These improvements gained by the new sample stage and holders, automatic data offloading and processing, in addition to increasingly better scripting means that we’ve more than doubled the time spent measuring in a year (Figure 1). More precisely, this means we’re exposing the detector for sample measurements for a particularly insane 72% of the time this year. Step into the MOUSE lab, and you’ll find the red light on.
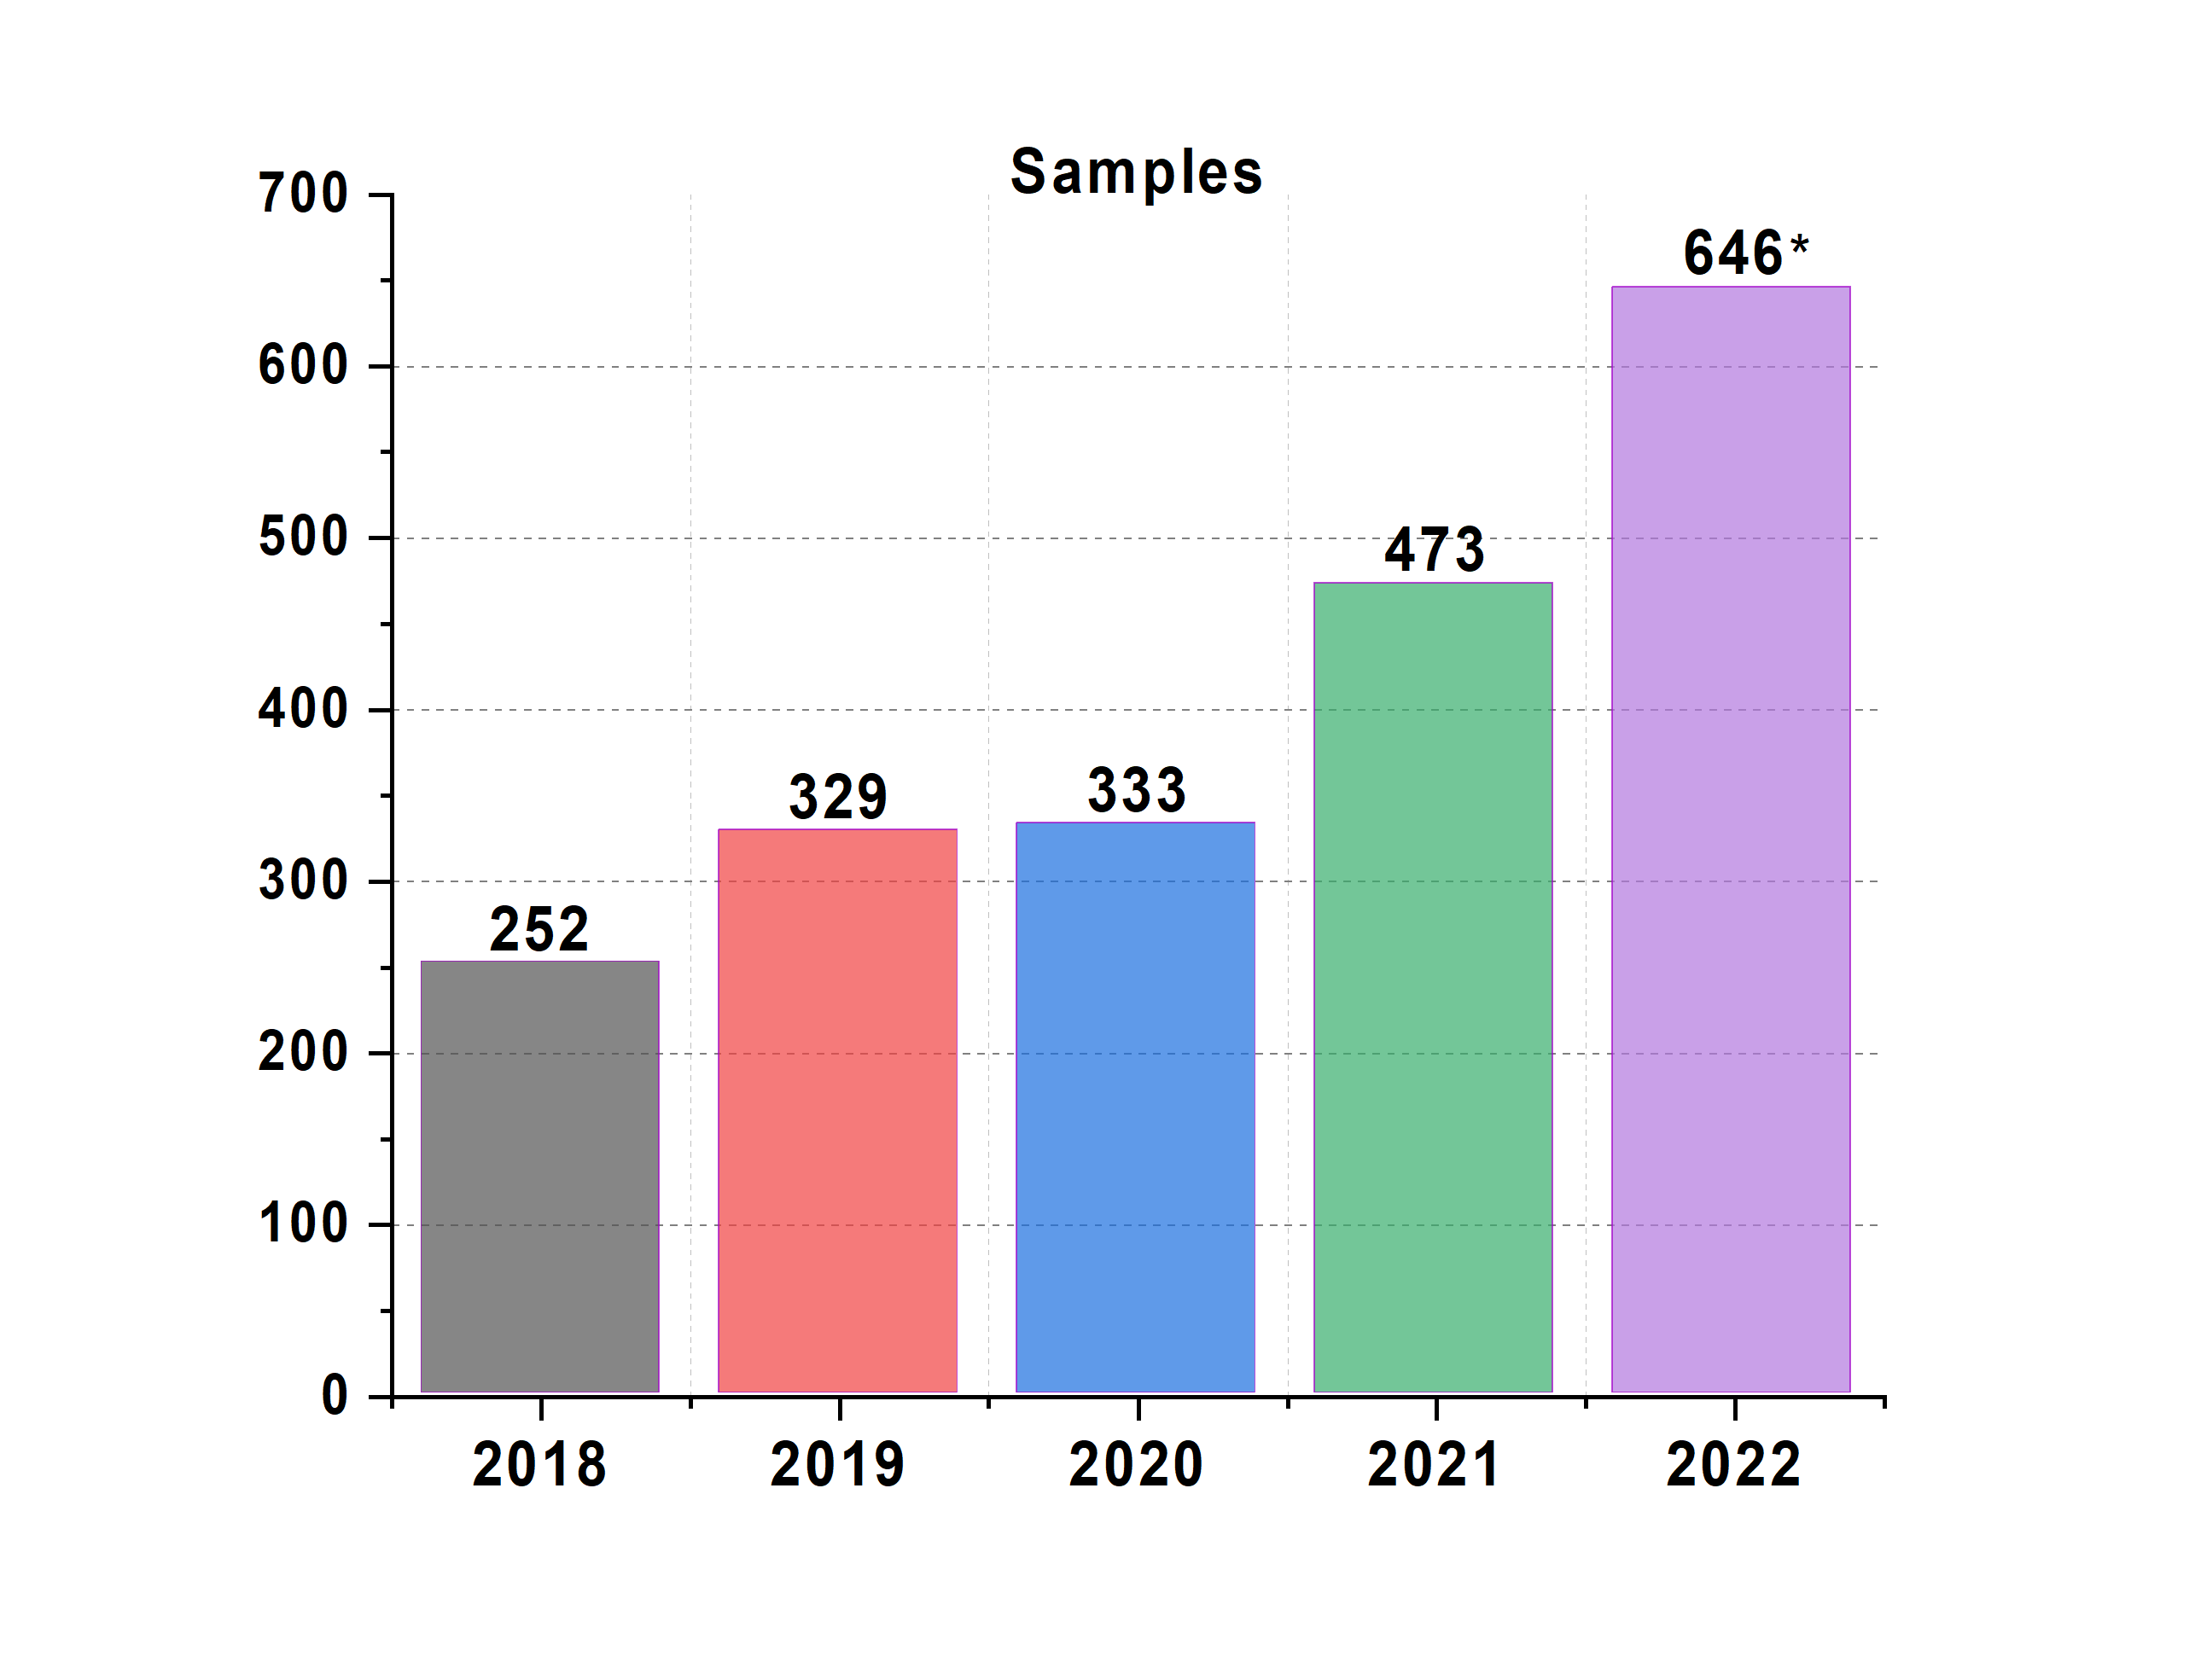
Samples: Compared to the start of 2018, when we started operating the machine with the new electronic logbook-centered workflow detailed in our paper, this year we’re able to measure more than twice the number of samples (we’re not even padding the numbers: background measurements are not counted, and in-situ and mapping samples are only counted once).
Due to this improved efficiency, we’re explicitly asking collaborators to make larger sample series, i.e. to provide us not with the minimum number of samples in a series, but with around 10 per parameter. This is not just better for the science, but also makes it much easier to identify nonlinear trends and outliers. Add to that our recent efforts at robotic generation of sample series, and hopefully we’ll not be running out anytime soon.
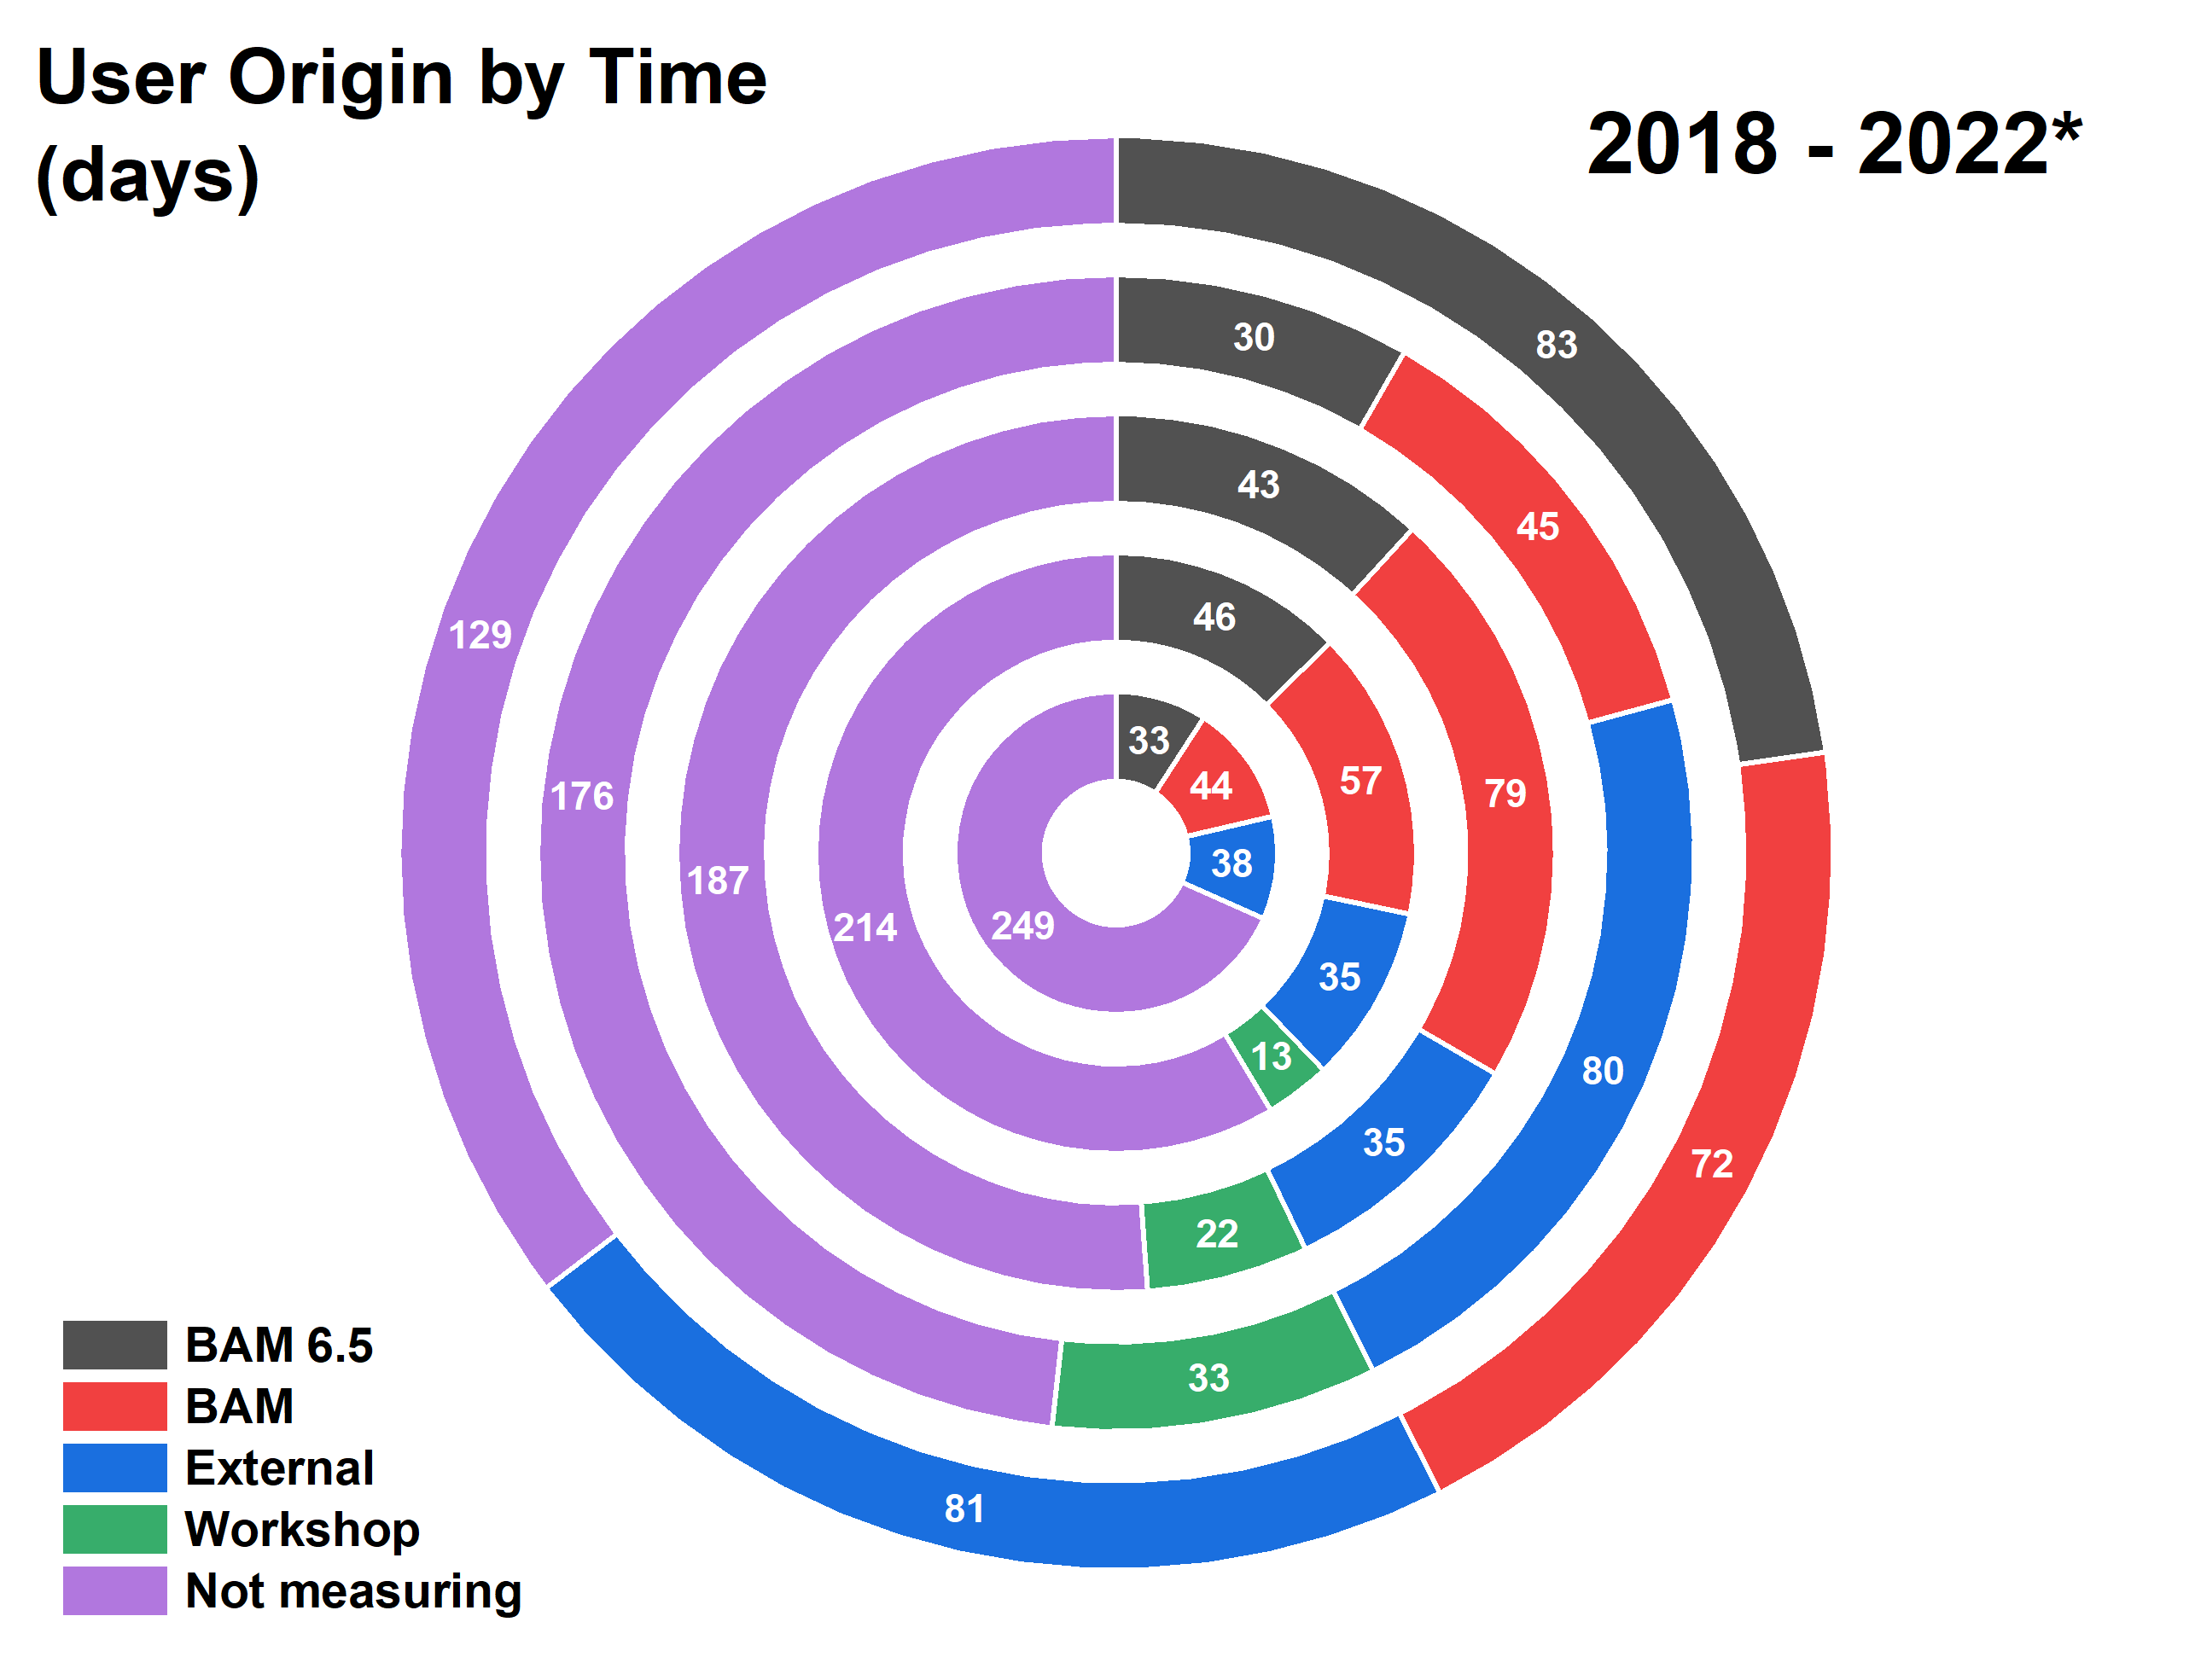
Time divisions: From the start, we made our time available to others both inside and outside of our institute. I am very happy to see (Figure 3) that we’re still serving all three sources of people equally.
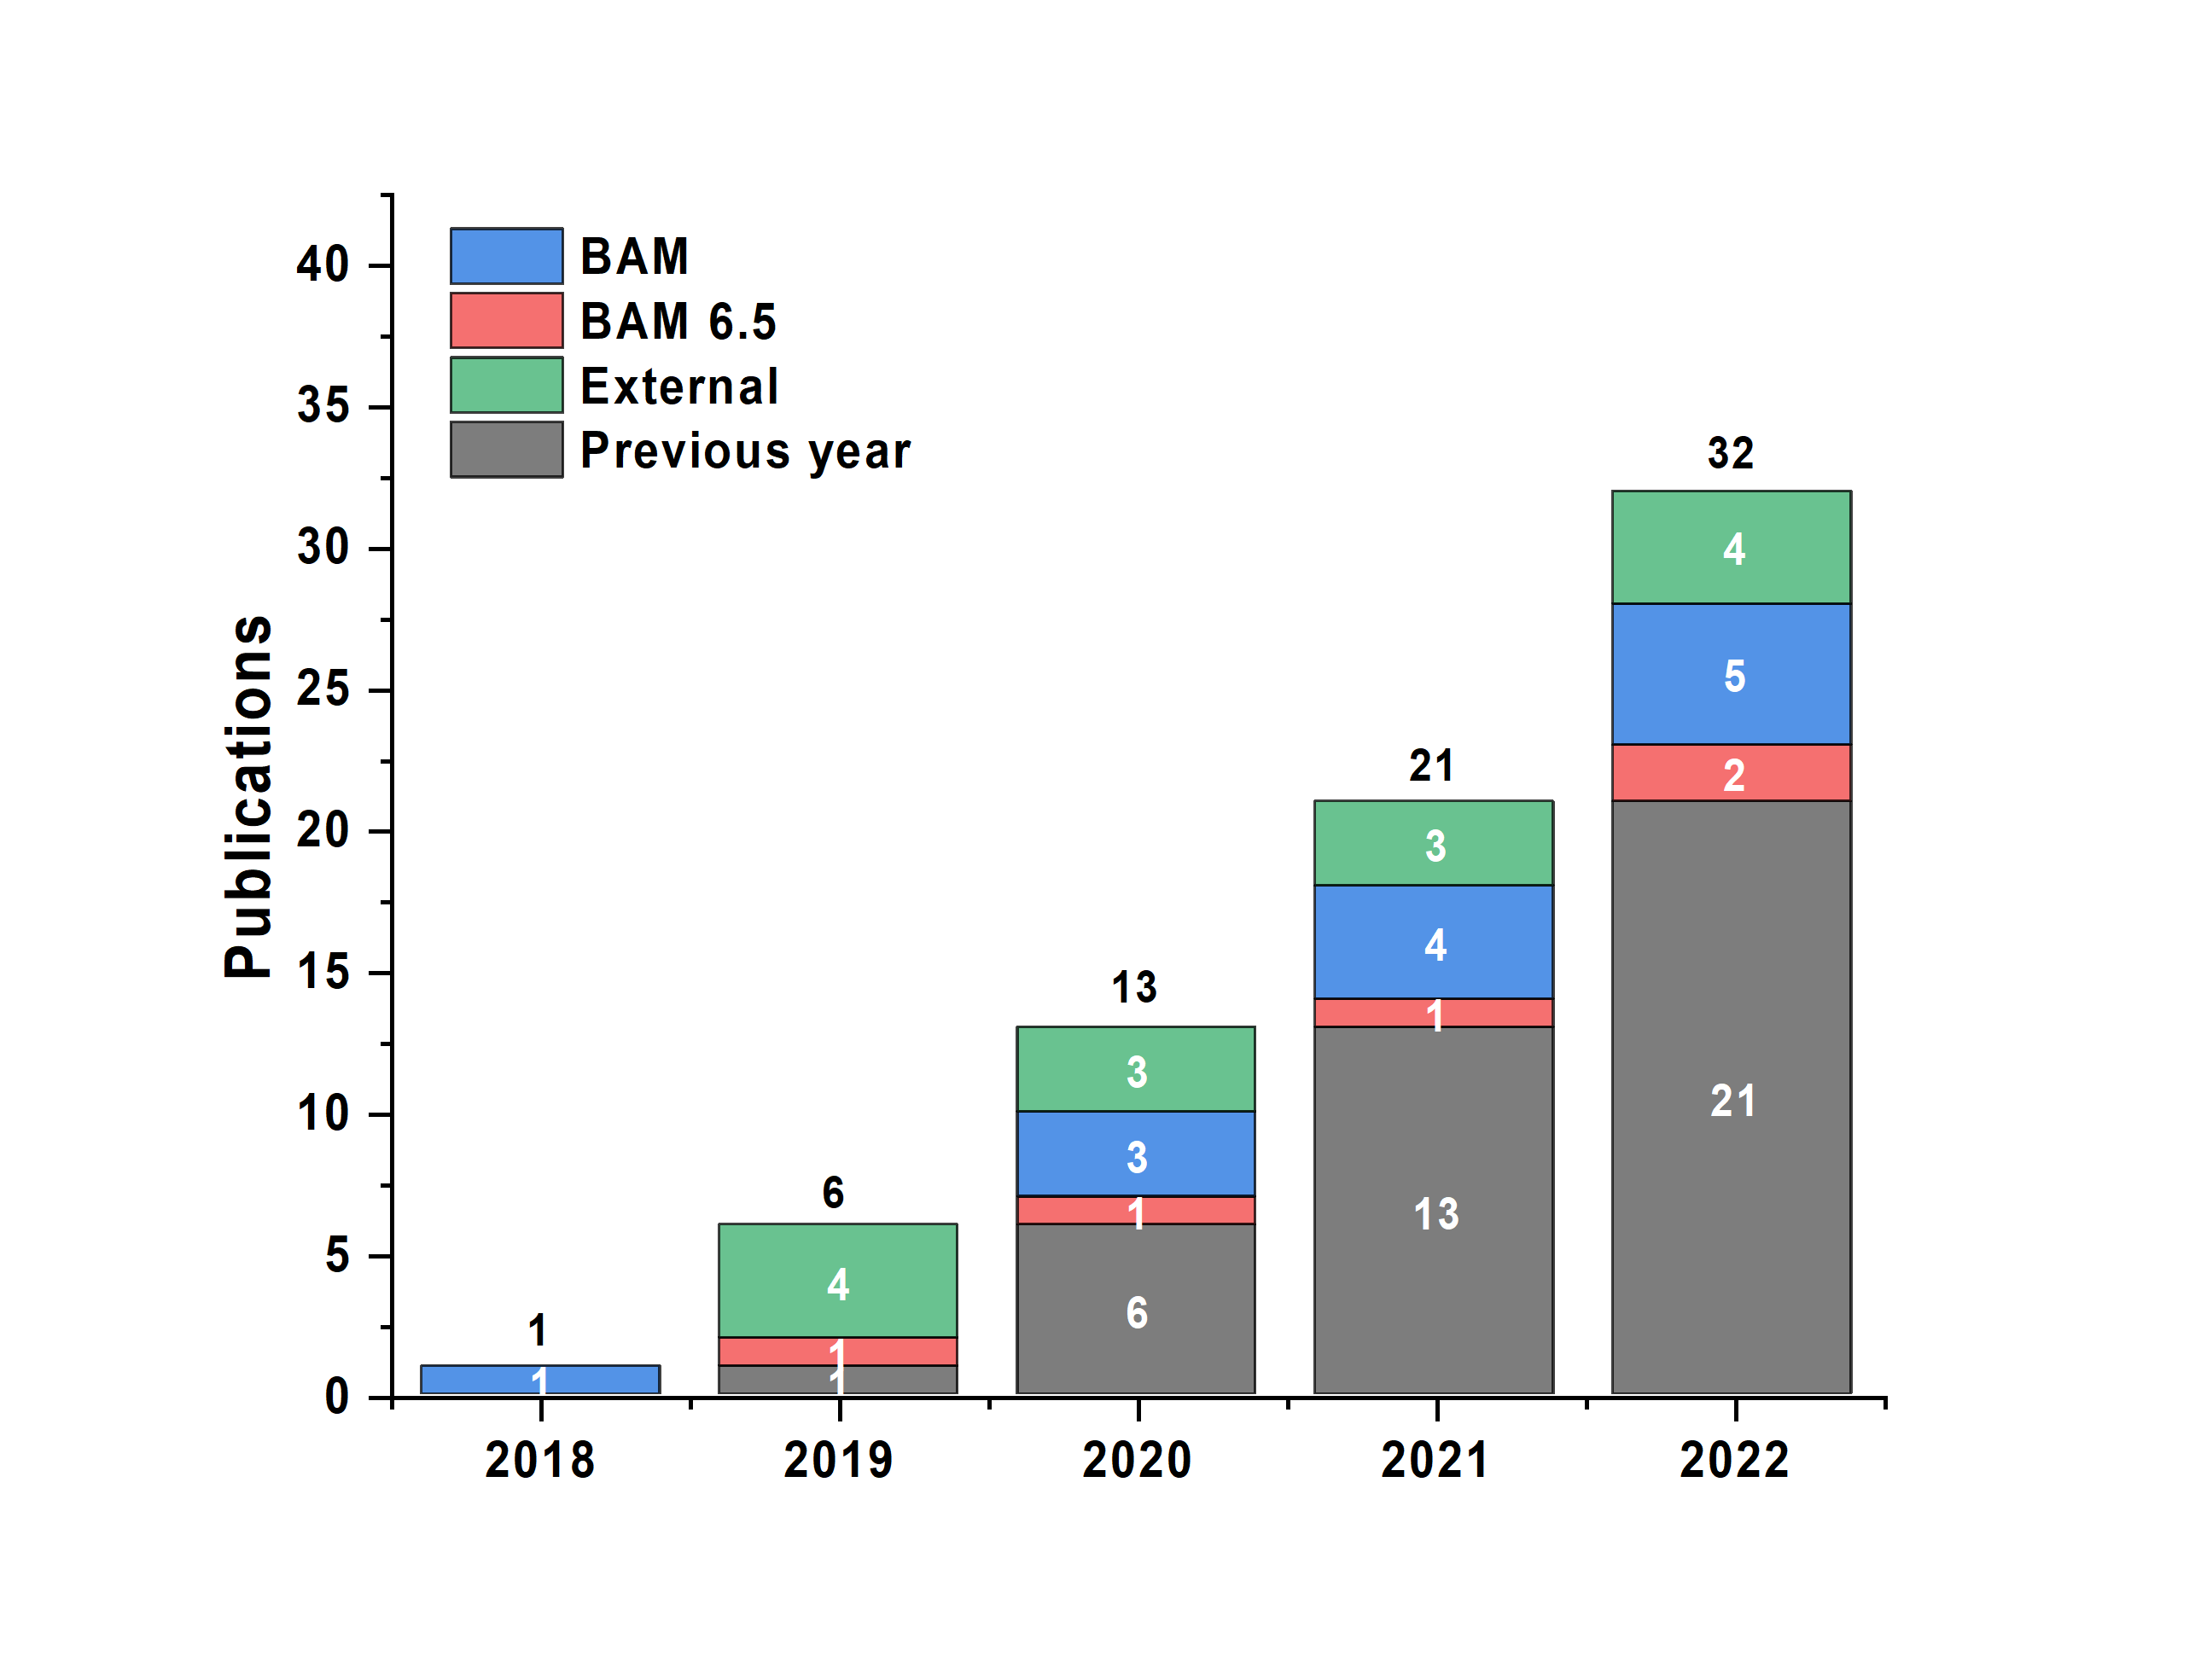
Papers: Finally, the cumulative body of work that the MOUSE instrument has contributed to is rising at a steady pace, again from all sources. We are both proud of the data that has been collected for these projects, and are happy to see the efforts pay off.
Remaining issues
It is never finished. While we have the SciCat data catalogue up and running, with 22k datasets in there now, I would very much like to start exploiting and exploring that trove. Likewise, there are improvements in operation to be gained by further shifting our instrument computer backend away from SPEC towards more future-proof technologies.
The data correction workflow, while running perfectly fine, is also due for a pure pythonic refactoring that would hopefully drastically improve processing speed and improve the uncertainties handling a bit more.
Furthermore, we’re also working on extending the data processing. The future looks like it’ll have a RunDeck backend with included automatic data merging (merging data from multiple configurations into a single curve), and an automated McSAS3 run to hopefully give us a head start with our current biggest bottleneck: analysis.
Let’s see what we can manage in the future.
Leave a Reply