

We’ve now started using Bluesky in production on the MOUSE instrument, after discovering how the queueserver ties things together, and it already has some advantages in how we can (re)organize and plan our measurements…
The current state
Before we get into the queue, perhaps it’s good to get an overview of the current state of the MOUSE. To help with this, Figure 1 shows a system overview of how the MOUSE hardware (left, grey) interacts with the user-facing elements (yellow).
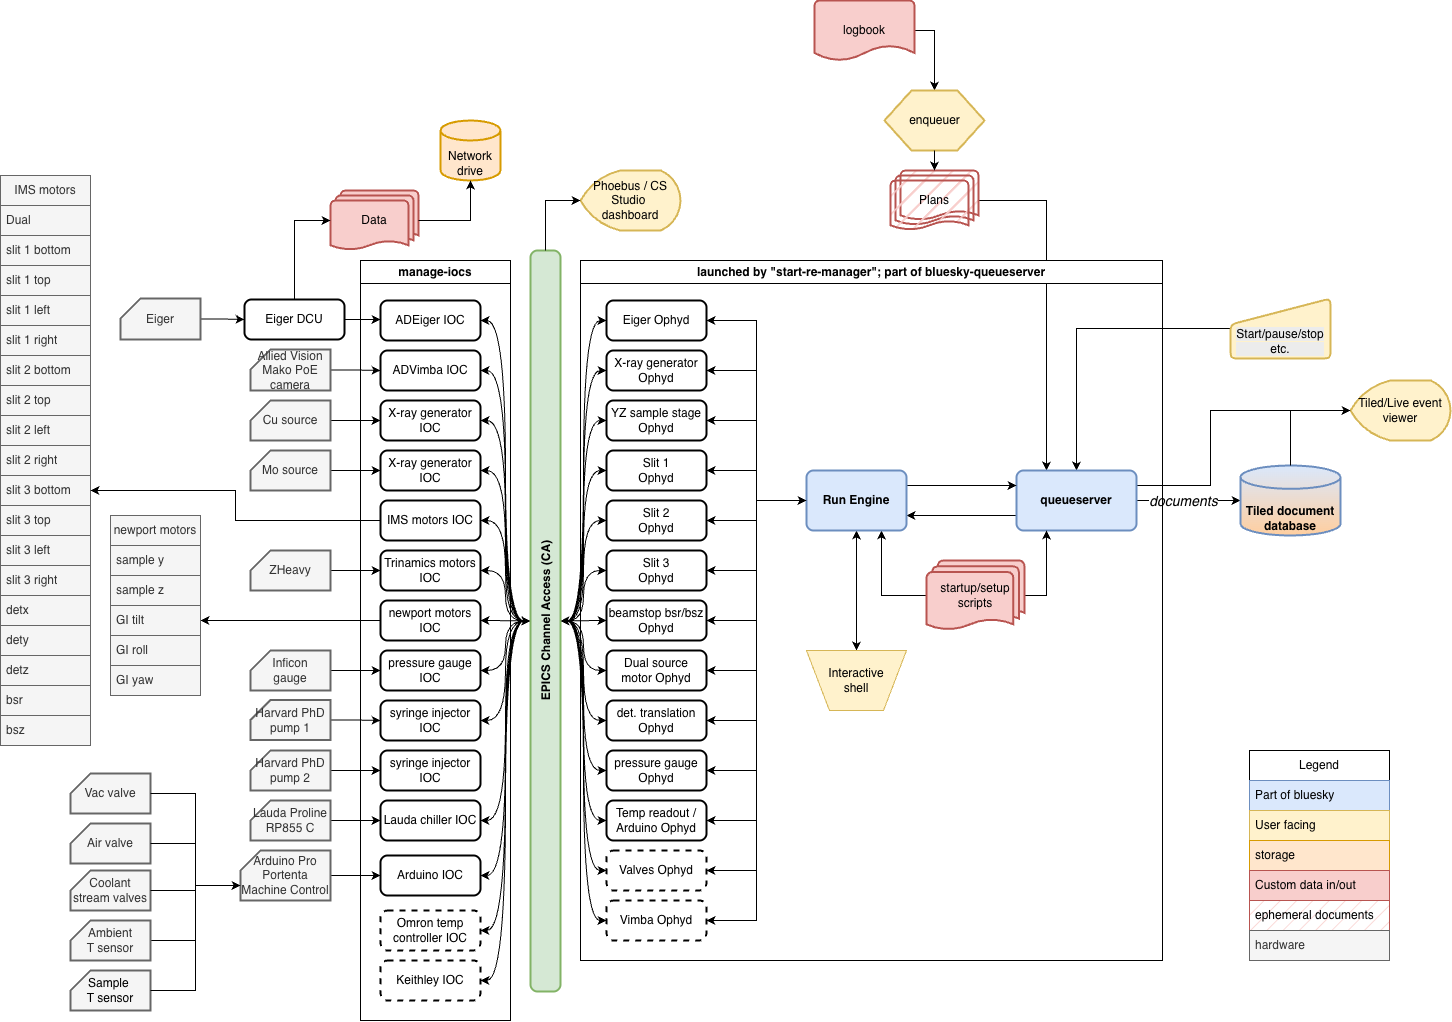
In general, we have two places where the user actively can control the instrument: either using the logbook with enqueuer (the standard way of using the instrument), or by using the interactive shell for near-infinite flexibility. When the queue is paused, the interactive shell can be used and vice versa.
Prior to this, we would sequence measurements configured in the logbook using one very large python script. Back in the days when we were running SPEC, we used a similar large script. While that works, it has some downsides:
- If the script has a bug in it, for example due to malformatted entries in the logbook or proposal/sample sheets, it can halt execution part-way through. Then we’d find and address the issue, and edit the script carefully to remove everything that had already been completed.
- Once a script had been started, we would be very hesitant to interrupt it for any reason. That made planning and timing the next experiments a careful job, making sure to prioritise as best we could. Any urgent samples would have to wait until the next available time slot, which, in the case of a full set of samples, could be up to two weeks later.
Bluesky queueserver, which you get for free with very minimal effort with the adoption of bluesky, solves both issues and gives you an extra added advantage to boot: wrapping the bluesky startup and configuration into a neat system.
The startup scripts
The queueserver comes with a tool called start-re-manager. This can launch your central experiment orchestrator, called the Run Engine, configure your devices and connect the callbacks to your databases and stream visualisers in sequence. For that to work, you prepare a “startup profile”: a series of python scripts which are numbered in a lexicographical manner, which get executed in sequence. For us, our “mouse” profile consists of the following tiny scripts:
- 00_plans: loading the allowed bluesky plans and defining the namespace
- 01_re: launching the central Run Engine
- 02_tiledwriter: setting up the connection to the Tiled database (which stores the documents that are streamed from the Run Engine with metadata and other execution details), and subscribing the Run Engine to that callback.
- 03_init_devices: all the Ophyd devices that the Run Engine will address are configured and initialised over here
- 04_baseline: before and after executing any plan, the baseline state of the instrument is recorded. This is defined here.
With that, the whole instrument control can be launched using:
start-re-manager --ipython-dir ./qserver_profile --startup-profile mouse --use-ipython-kernel ON
At this point, the manager is started, but the run engine and queue has not been initialised yet (though you could set it to do this automatically). You do that by launching qserver environment open. This will then run through the startup scripts to set up the environment. If all is good, after a few seconds you should be ready to go. qserver status should show you this with a re_state of “idle” and a ip_kernel_state of “ready”. If there were leftover items in the queue from the past, they will persist and still be waiting in the queue, so you can either continue where you left off or clear the queue.
Interactive mode
We haven’t yet played around a lot with the interactive mode, but this is what you’d use for e.g. alignment scans and bespoke plans for complex, one-off in-situ and operando experiments. You’d launch this with qserver-console or qserver-qtconsole when the run engine state is not “busy”. You’d get a normal interactive python environment with the added bluesky sprinkles on top (such as a host of predefined scan methods, live plots and tables, and live fitting). Naturally, you can also access and “move” all your devices (motors, syringe pumps, chillers, temperature controllers) synchronously or asynchronously, and make new plans on the fly as needed.
Queue mode
Our main mode of operations is in queue mode (a good tutorial is here: https://blueskyproject.io/bluesky-queueserver/tutorials.html). Every plan in the queue carries out one nominally 10-minute measurement of a sample in a configuration, complete with a separate 20s beam image (beamstop and sample out) and 20s beam-through-sample image (beamstop out). Besides the “to-do” queue, the history is also maintained, so after a week of operating, we now have over 700 items in the history, and over 100 items still in the to-do queue. Apropos, there’s also a “loop” option in the queue, but unlike your music player, no “random” option yet.
Depending on the collating policy (“ALLOW” or “FORBID”) for the programmed samples, either all samples in the contiguous “ALLOW” block are measured before changing the instrument configuration, or a sample is measured in all configurations and repetitions before moving on to the next. You can make some funny sequences this way by interspersing “ALLOW” blocks with a “FORBID” measurement (e.g. a background or a time-sensitive sample).
At the moment, this is the only measurement plan we have prepared, but we can easily implement another if we have regular measurements of another type. It works and queues in the same way.
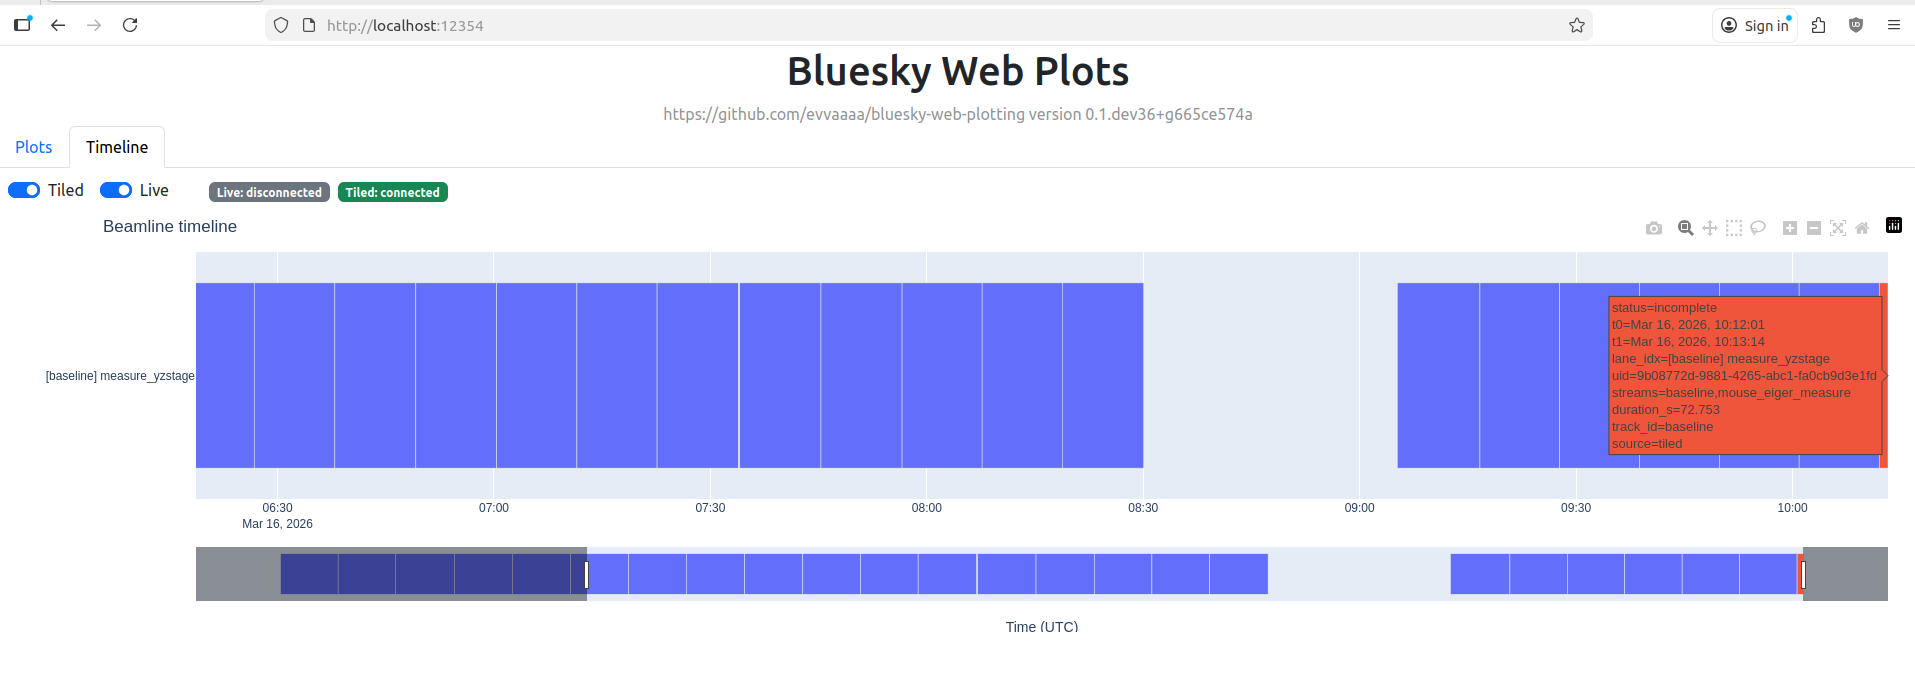
As for the previously mentioned issues, issue number 1 is now resolved (assuming the queue policy is set correctly): if a plan fails, this is recorded in the document stream sent to Tiled, and it just continues with the next one in the queue. I’ve a basic timeline viewer under casual development that shows me how the queue is progressing (Figure 2), and any issues with a plan will be highlighted in a different colour.
Randall Munroe xkcd.com).
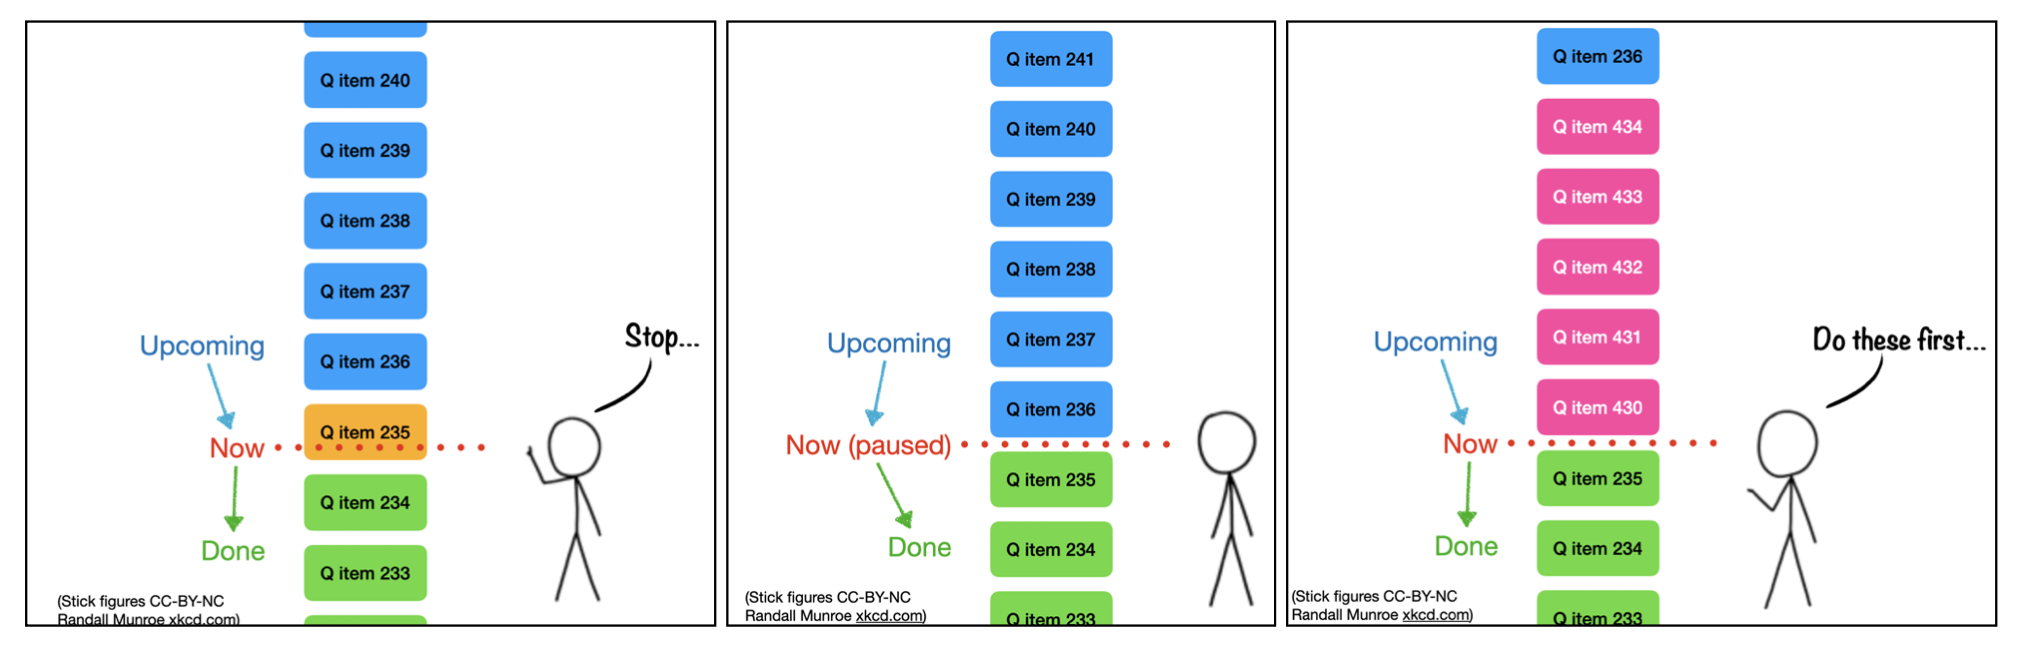
This week, we also tested the functionality to solve issue number 2: inserting urgent priority measurements. Naturally, reordering a queue is one of the benefits of having one in the first place. But even without touching the queue itself, we can now insert priority measurements incredibly easily. Figure 3 explains this in graphical form, for which we have convenience shell scripts now.
So in practice, we got some time-sensitive samples, stopped the queue, opened the instrument vacuum chamber to insert the samples, evacuated and enqueued the time-sensitive samples with priority. Additional background measurements were then placed at the end of the queue (i.e. without priority) and the queue was unpaused again.
Still easier: with a UI
There’s a few institutes that have created user interfaces to deal with the Bluesky qserver, including offering an interactive interface alongside the queue interface. Some examples are this one from NSLS-II, and this one from HZB. Those should be drop-in modules, so next chance we get we will try them out and report back.
Why though?
The end goal of all this is to make it easier and more robust for our staff to use the instrument for normal measurements. While they have been able to do measurements, the incidents (mostly due to malformed inputs and instrument state changes due to interleaved manual experimentation) were still too frequent than I’d like. With the new tools this should dramatically improve.
The second big advantage is that we are relieving our technical debt here: we are reducing our reliance on in-house programming and instead leveraging an ecosystem that is developing at a very rapid pace with a user- and developer-base that is, frankly, astounding. The foundation is well-documented (if you know where to look; the organisation of those documents could use some improvement) and open-source, and is rapidly becoming the standard at many institutes. Bluesky is even the foundation for the lab automation platform NOMAD Camels, which comes with a very extensive library of supported hardware.
Lastly, the modular architecture also means that adding functionality can be done easily on an as-needed basis. For example integrating automated optimization methods for, say, instrument alignment or sample property optimization should be as easy as installing e.g. “blop“. With a bit of care in hardware selection, you can also ensure you have minimal installation troubles.
Should you transition to bluesky?
Depending on your situation, perhaps not. If you’re running just some standard instruments in your lab and you’re not intending to go outside the boundaries of what the manufacturer envisioned, or if you have no need to integrate data collection with data curation tools (lab databases, electronic lab notebooks), then just use as intended. “We’ve always done it this way, and it’s always been shit” is sometimes the lowest-resistance, boring path forward that will not be questioned.
However, bluesky is definitely a good contender if you:
- do not fear experimentation, and are comfortable on the command-line,
- need to be on the cutting edge, expand the capabilities of your devices, want to make an automation-centric digitalised laboratory, or need to integrate your methods in larger institute-spanning strategies.
As for our lab, we’ve demonstrated that with some extra effort, this transition can be done gradually while the instrument remains in very active use. It just takes extra care and planning, a consistent step-by-step approach, and some perseverance. Only when the functional parts click into place, the bet will start to pay off. As always, YMMV.