

Every now and then I wonder why I’m spending a significant amount of time coding. A penny dropped when I was listing my code projects: I (have to) own a – frankly insane – amount of code to cover many parts of the SAXS workflow. I know many of you have similar code burdens, so perhaps there’s some stuff you can reuse from mine to help your work. Here’s an overview of what I have.
Over the years, I’ve accidentally gotten moderately better at code design and maintenance, and so we regularly rewrite software to newer, better standards. Nowhere near what a software team can do, and I wish I had a team to rely on for these, but we make do with what we have.
I also hate to admit it, but the process of maintaining the below software has become somewhat easier with LLMs like Codex, Copilot and Claude integrated in VS Code. With them, I can more easily ensure we have a functional set of unit- and integration tests with the software, as well as documentation on the code design and design decisions – both things that previously I could not free up enough time for. With copious amounts of handholding, verification and care, I managed to use it to make some foundational improvements and homogenisation as well. I hate that I have to use it, but it is what it is.
(Apropos, I still take pride in my writing and you will *never* find AI-written text or images on my blog or in my papers. These are and will remain AI/LLM-slop free.)
We can separate the software I own into different categories, depending on the stage of the data pipeline they’re in. All software I write is open source, and so links have been provided in case this may be of some use to you. I have only included currently maintained code in here, and left out any older, abandoned packages.
Data collection code
We used to own many scripting and orchestration tools for automating the MOUSE instrument, but this recently reduced in size a bit by adopting Bluesky. We still own the code to read and validate our logbooks and project/sample sheets, and plan the measurements and enqueue them on the Bluesky queue server.
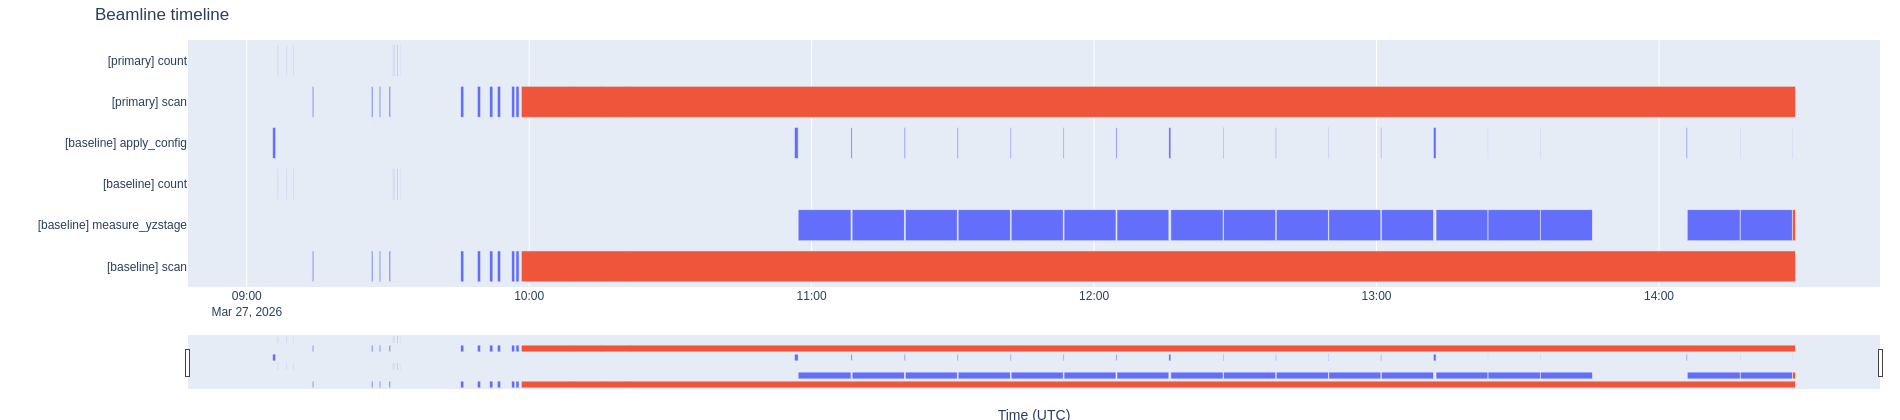
We also have a bluesky timeline plotter (still in MVP – minimal viable product – stage in a separate branch in the repository). Besides that, we have a few tiny pieces here and there for controlling various hardware. These are a bit more ad-hoc and pragmatic in their design, and are listed in this post.
Data preprocessing code
Because we are not getting the data in the form we want, i.e. with all the sample metadata and beam parameters we need, we need to do some preprocessing of the data first. For this, we have the somewhat modular MOUSEDataPipeline package. This package takes care of transforming the data into a NeXus-proximate file, with some additions to make it ready for data correction. There are some HDF5-to-HDF5 translations in there, which are taken care of by the HDF5Translator package about which I wrote here.
Both the MOUSEDataPipeline, the correction and the subsequent small steps (dataMerge, for example) are sequenced using the open-source version of RunDeck.
Data correction code
MoDaCor, expanded upon in this blog post, is currently at the MVP stage, and I will write more about this once we have the service running and finally replace both DAWN as well as SAXSQuant with it. MoDaCor is the best thing since sliced bread for comprehensive, traceable corrections. It can be found here, and actually has half-decent documentation, also on its server-based API. I am now trying to get buy-in from large facilities to ensure it has a larger foundation of use and additional support.
Data analysis code
Once the data is correct and reliable, we move on to data analysis. We use a range of software including SasView and SasFit, but usually rely by default on McSAS as an easy go-to program that fits most data.
The latest version, McSAS3 and its accompanying GUI are extremely capable, both for one-offs as well as fitting thousands of files, leveraging the power of the extensive SasModels library underneath. The manuscript for McSAS3 has been submitted, with the preprint available here.
Data upload code
To upload the pre-correction and corrected datasets to our institute’s OpenBIS repository, we had to generate some custom code that reads the logbook and measurements and places them in the right locations. That code might be useful to those of you who also need to deal with OpenBIS.
Data simulation code
Naturally, you will want to make sure your analysis is giving you sensible structural parameters. One way to verify that is to simulate scattering from known, similar structures and see how your analysis performs on that. We have two packages for that, both are a bit older but remain useful:
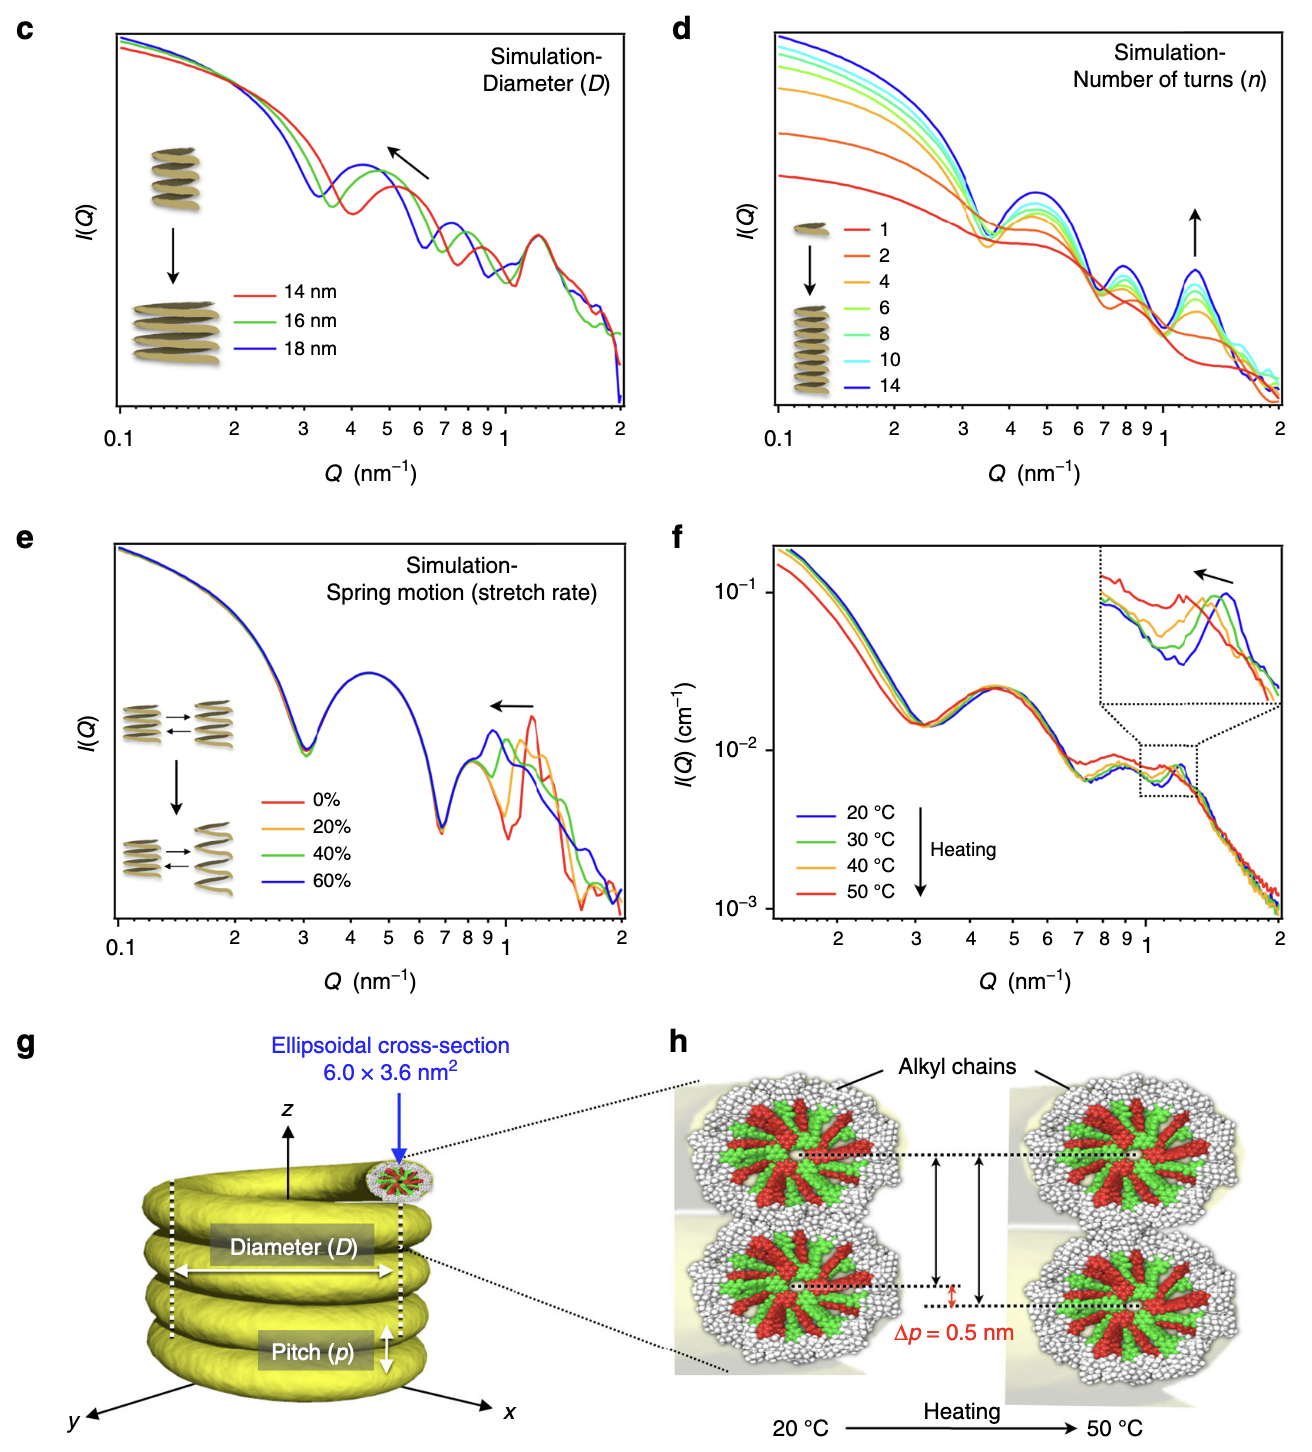
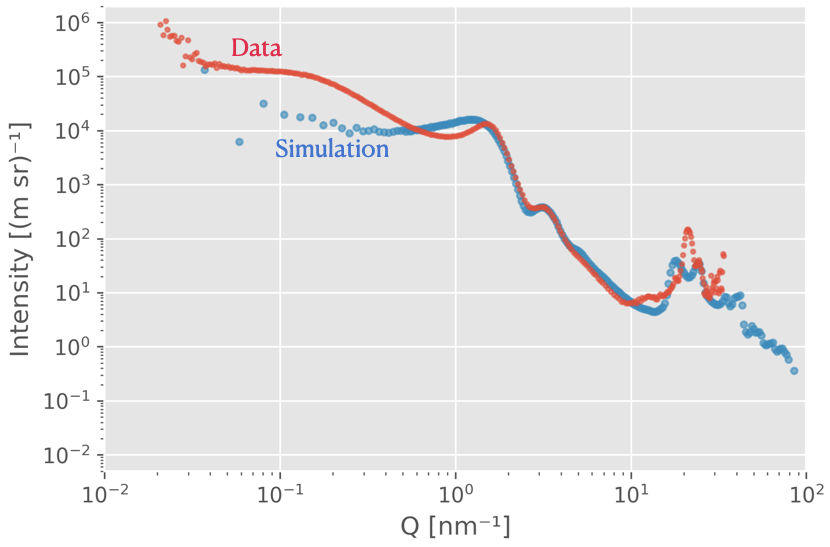
SPONGE can simulate scattering patterns from input STL files. This uses a Debye equation underneath, inspired by Hansen’s method, with randomly-placed points through the structure. It’s been very useful for a number of papers to identify how specific scattering features are linked to structural parameters of complex structures. It’s been published as a section of this paper.
Ultima Ratio (the “Last Argument”) is a more brute-force program. Feed it a 3D high-resolution electron density map, and it will Fourier transform the thing to give you scattering, diffraction and even PDF for whatever you have. While powerful, it shifts the problem to the question of: “how do you generate a high-resolution electron density map for your sample”? And I’m talking electron density map resolutions that will not fit your computer memory (especially at the current memory prices) of 10.000 x 10.000 x 10.000 points. We submitted this as a manuscript a while back (preprint here) but it was rejected as the application example we added wasn’t very good. It’s on my list…
Educational tools
Lastly, we have a range of educational tools that are needed to help the next generation understand some of the aspects of our life. For this, I own two packages:
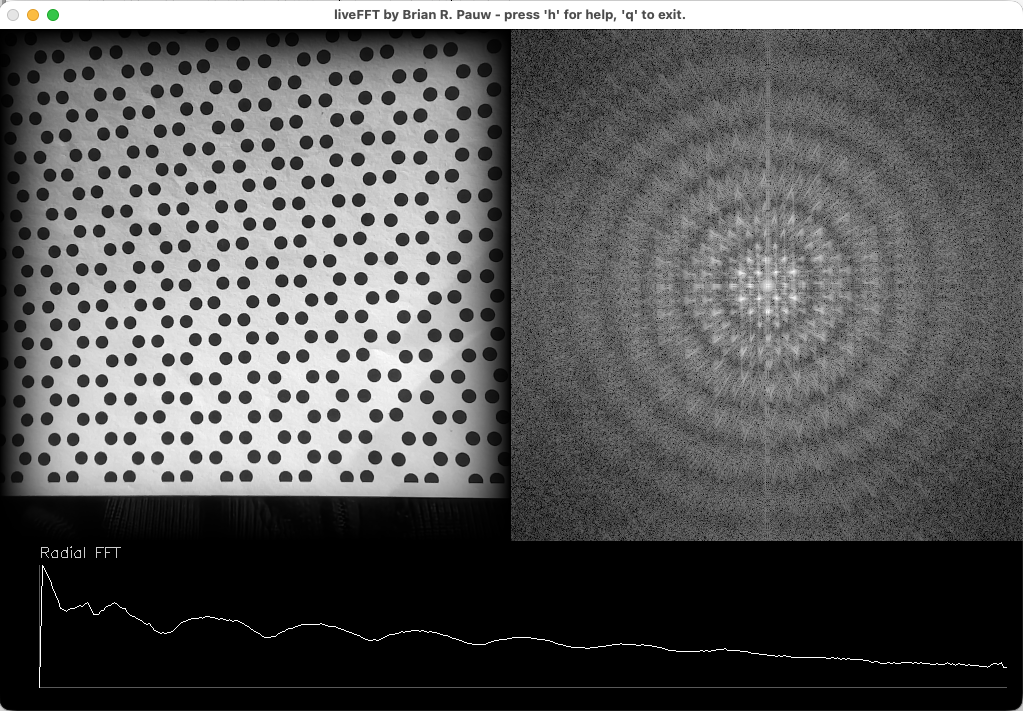
LiveFT is a program that displays the intensity of the Fourier transform (i.e. the “scattering or diffraction pattern”) next to the input laptop camera image. Hold a sheet with a shape or a pattern in front of the camera, and see how it would theoretically scatter (sort of… there’s a restriction to 2D). Very useful, has been praised a lot by audience members and educators alike. A manuscript is almost ready to be submitted (still trying to figure out code signing of the compiled programs.. Thanks Apple, for making this complicated!).
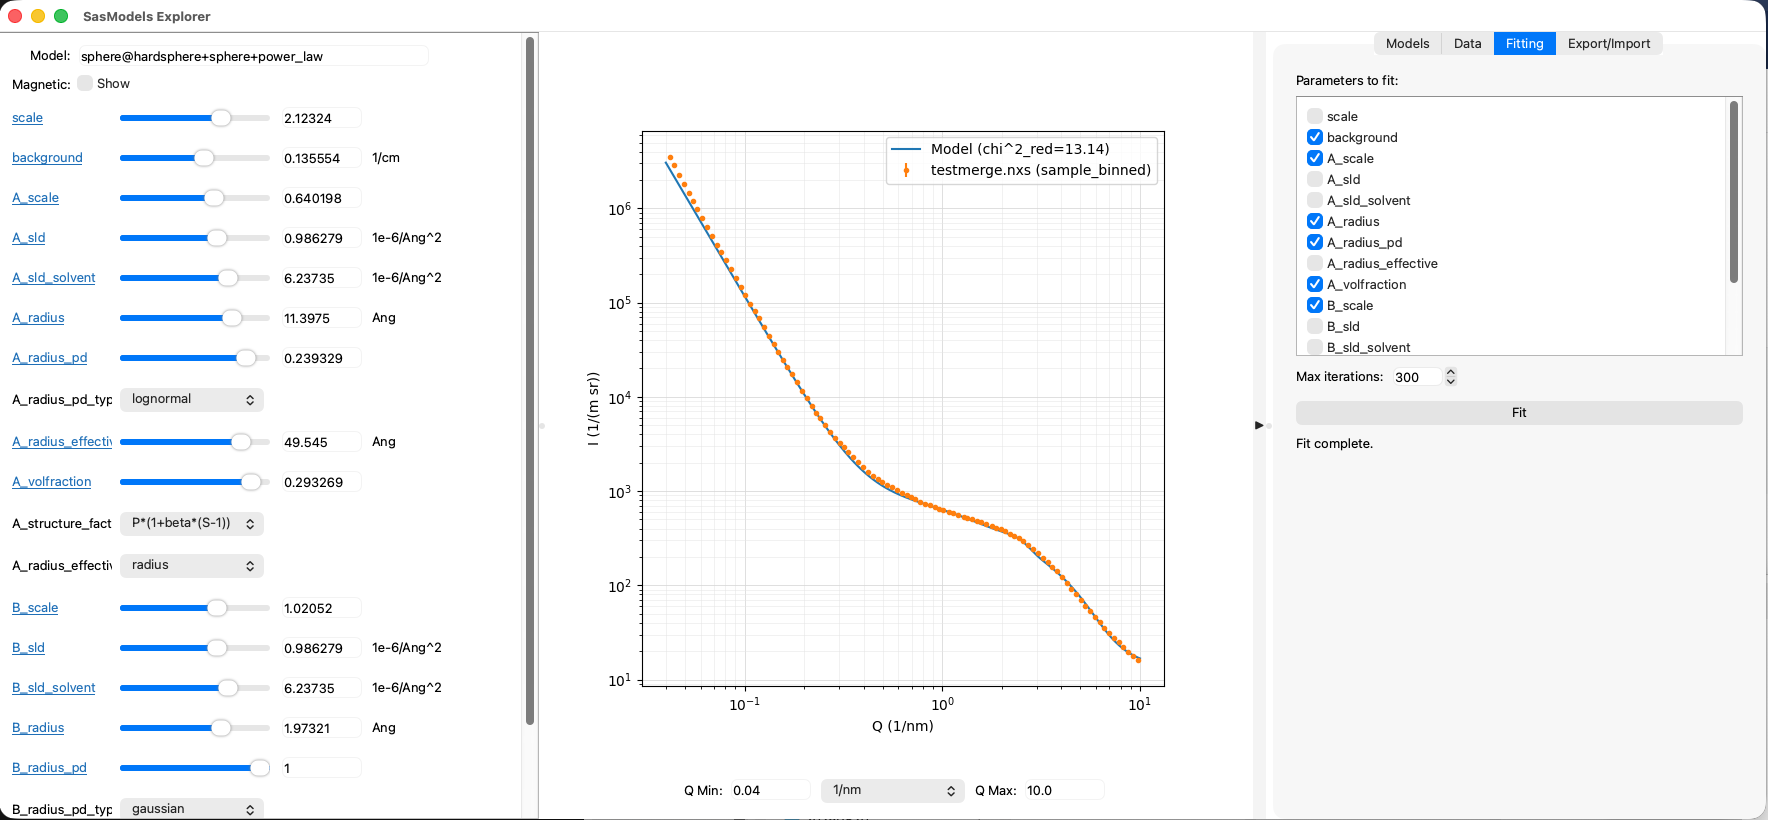
SasModelsExplorer (or SME for short) is a program that lets users play with the excellent SasModels library (not mine). Using sliders, SME allows you to explore how individual models or combinations thereof behave when you move their parameters around. It also has a rudimentary data loader from McSAS3GUI in a side-panel as well as least-squares fitting for basic fits. It can export the model configuration so you can use it as a basis for your McSAS and maybe the SasView fits. Another manuscript is in the very early blank-page state of preparation for this. But, feedback on the program has been very positive.
All deez nuts.
So, there you have it. As far as I can tell, that is the spectrum of software I am currently responsible for (each of them receiving a little love whenever I need them). I wish it was far less, but each serves a unique purpose in our work and workflows. Given our high-throughput, data-driven lab, we have no choice but to ensure we can deal with that data. One day, I hope to have a team to maintain and evolve this legacy. Believe me when I say that automation does not make for less work!