

By the way, my topical review paper on SAXS data collection and correction has been published and is available open access here!
Ensuring that a measurement gets you the right values is quite important for any scientist. One way of finding out what the quality of your machine is, is to compare your results for a standard sample with those measured by others on their instruments.
Exactly this has been done by Adrian R. Rennie and coworkers: their publication (also open-access arXiv version or institutional repository version) details the results from analysis of a sample of polystyrene measured at a variety of neutron scattering instruments as well as an X-ray scattering instrument. The analysis and conclusions reveal a few telling issues with small-angle scattering measurements and instrumentation.

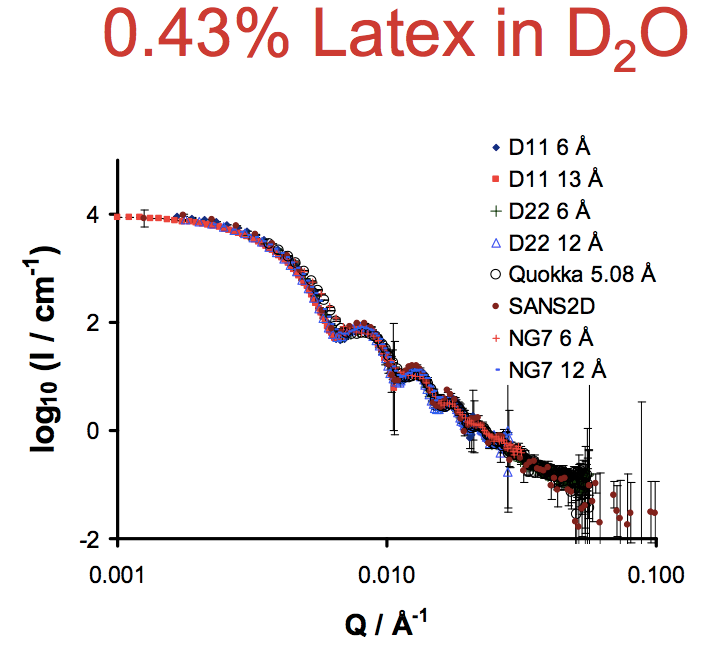
Firstly, the absolute value of the scattering power recorded on various instruments varies quite a bit. While literature commonly assumes this to have an absolute uncertainty around 10%, here, the datapoints at a given q can vary up to 15-20%. The differences between the measurements appear to be due to a lack of corrections for instrumental smearing rather than calibration, and it is found that after correction, the differences between absolute intensity values are reduced to about 10%. A volume fraction deduced from these instruments can vary proportionally.

Secondly, the instruments give the right mean size of the polystyrene sample, but the width of its size distribution differs by up to 50%. This too appears to be related to the uncertainty and smearing introduced by the instrument components rather than detection statistics.
Thirdly, multiple scattering corrections are required due to the high scattering probability for neutrons. This is approximated to good degree by a double-scattering consideration, simplifying the data fitting process greatly.
Lastly, counting statistics are not much of an issue. Even with these neutron scattering measurements, the detected counts are high and uniform enough (when integrated) so that the other corrections (instrumental smearing, multiple scattering) need to be considered as they start dominating.
The presentation of the work is very nice, but I would have liked to see a comparative table of the fitting results per instrument rather than a textual summary. Nevertheless, this work clearly shows where the attention of the metrologists needs to be directed.
More information on the measurements and results can be found on the CanSAS pages
Leave a Reply