

Despite a breakdown of the instrument, or maybe because of it, 2021 has seen an amazing performance by the MOUSE lab. This is largely due to the tireless efforts of Dr. Glen Smales and I in keeping the machine fed and gradual streamlining of the measurement methodology… Let’s dive in to the statistics..
We had been planning and preparing a few changes to the MOUSE hardware and software, but never really had the time to implement and troubleshoot these. In February, however, the detector blew its fuse for the second time, and this time the fuse holder broke on our attempts to open it. That meant the detector had to be sent in for repair, and so we were without measurement capability until mid-May. This opened upgrade opportunities as detailed in this post. In short: a 48-sample sample holder, new sample stages, and upgrades to the scripting and processing software.

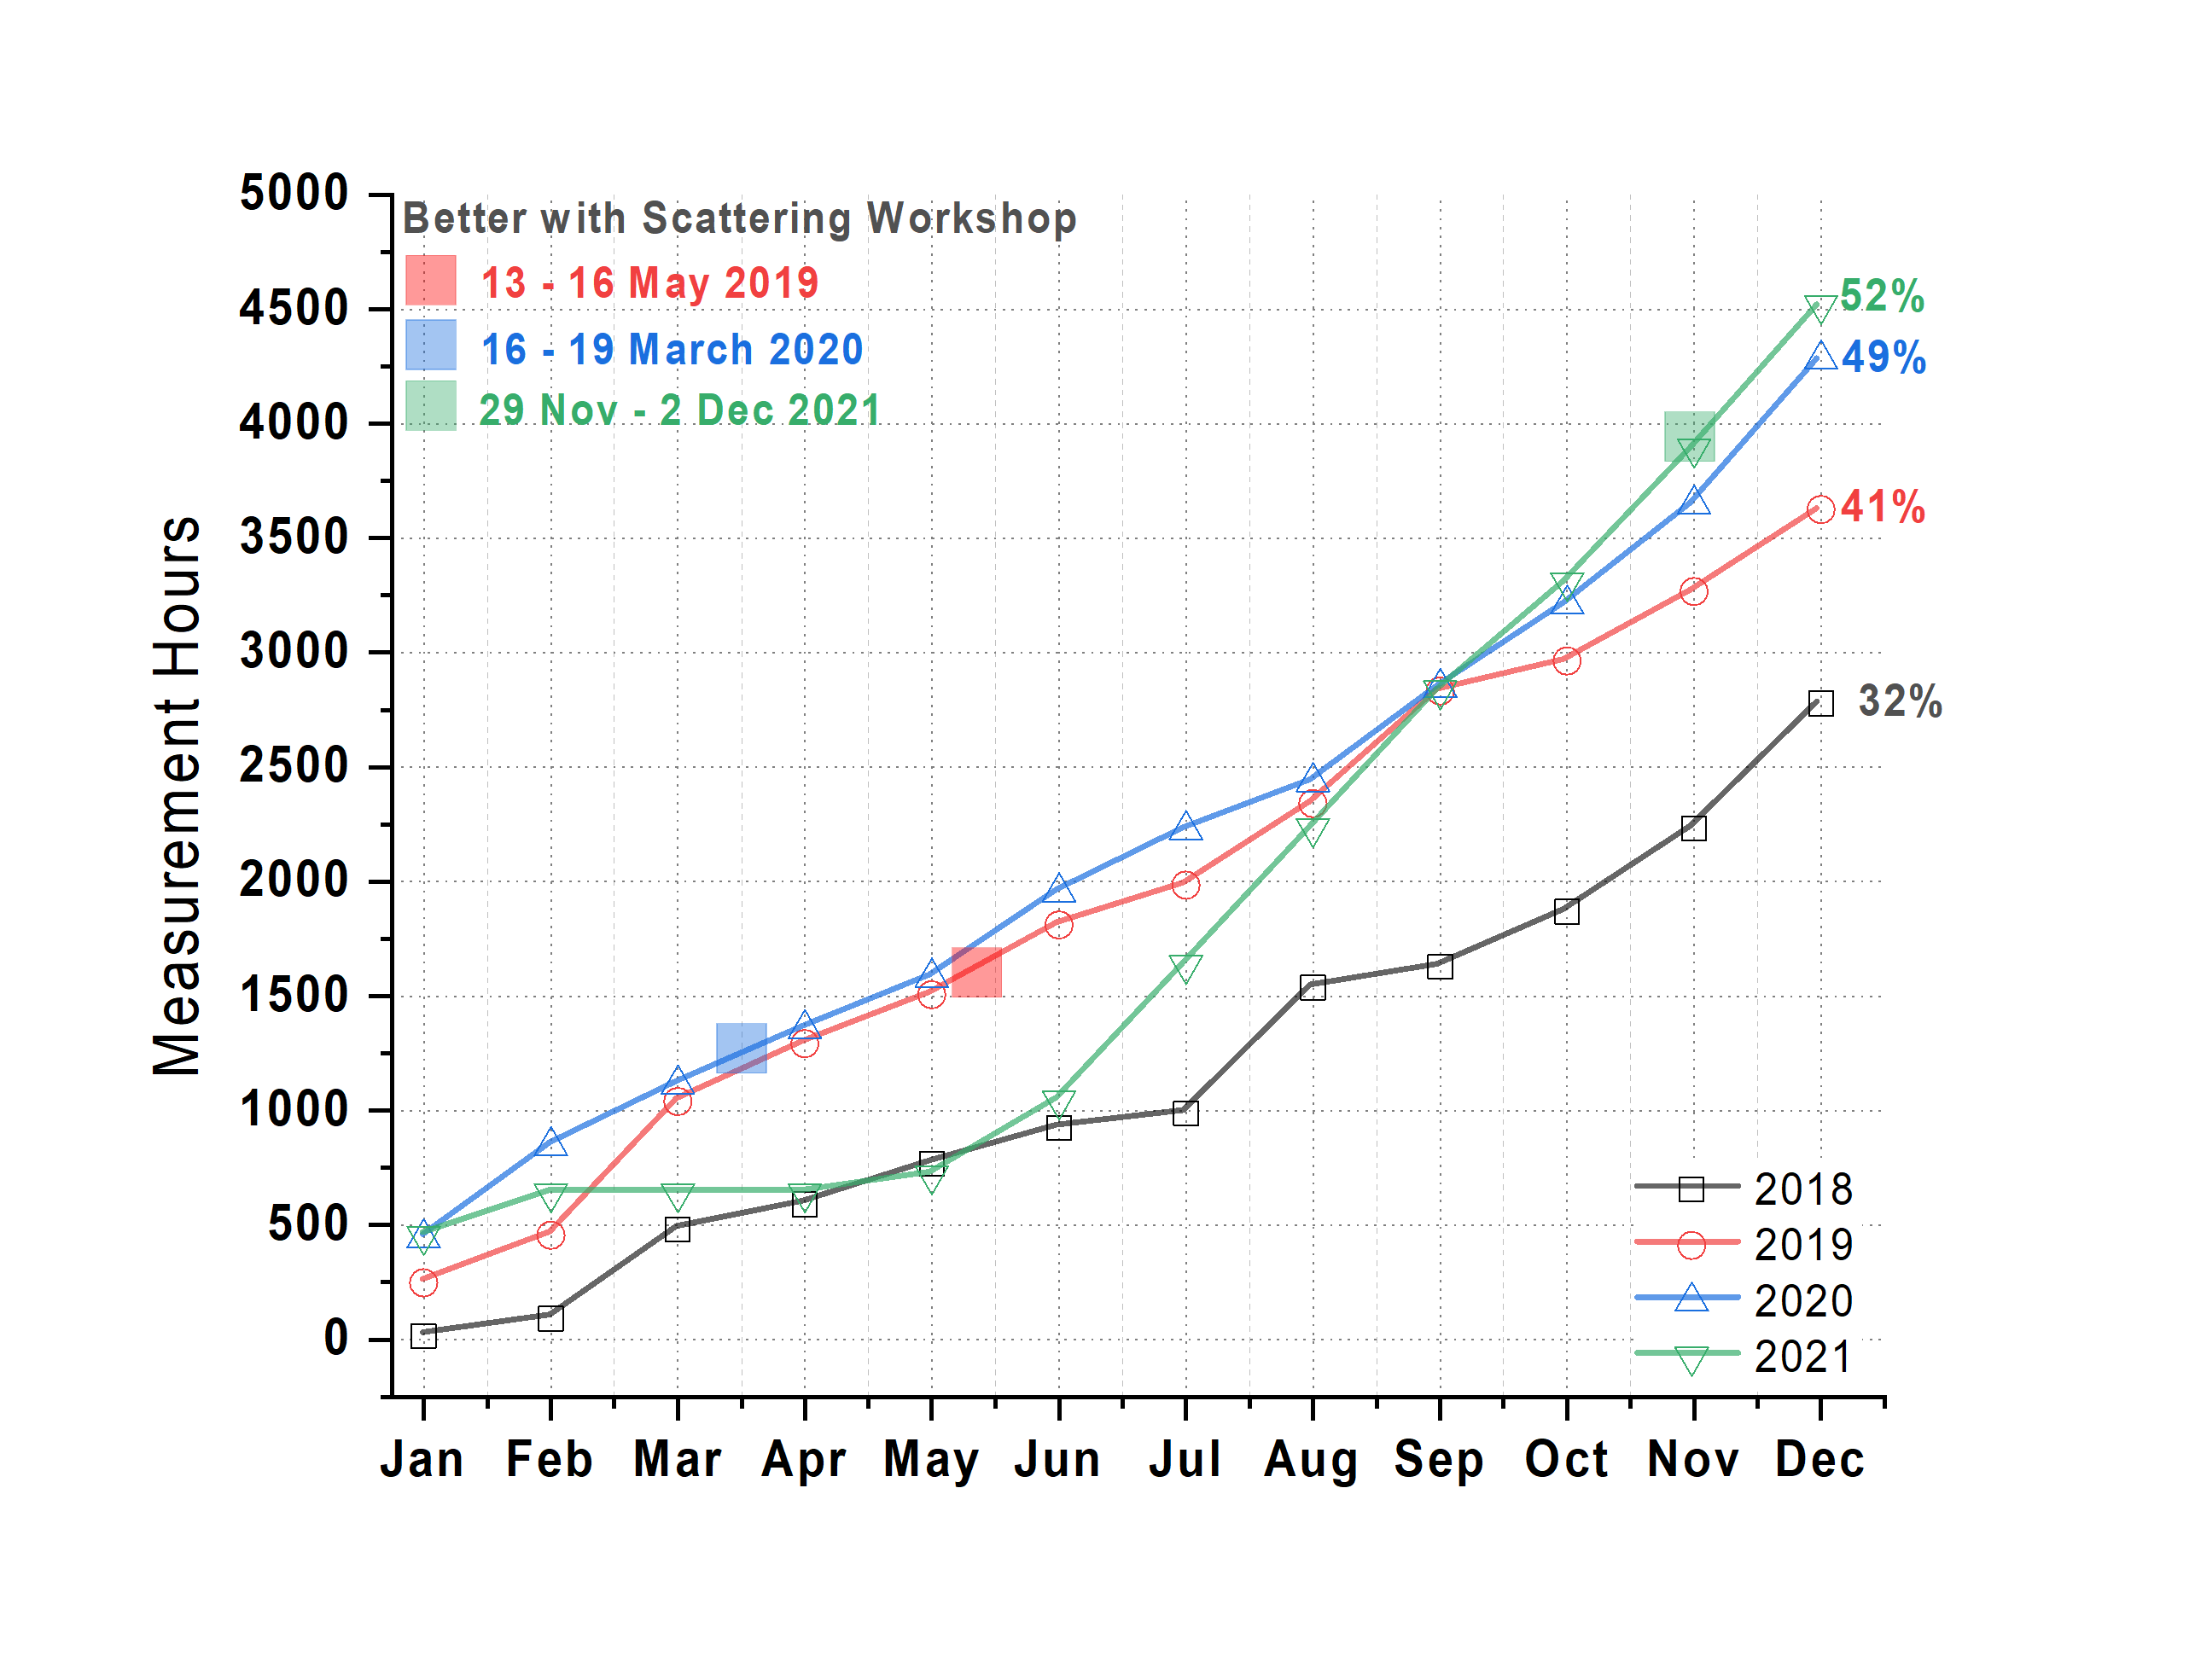
The results of this forced downtime are immediately evident when we look at the cumulative measurement hours (Figure 1). After the breakdown, the rate of measurement was considerably higher, leading to us beating the already groundbreaking 2020 rate in September 2021. At the end of the year, the detector had been exposed for slightly more than 4500 hours for actual sample measurements, or 52% of the total amount of hours in a year.

Figure 2 indicates a considerable increase in measurements for our external scientific partners, as well as an increase in measurement time used for the samples from the workshop participants. The 2021 Better with Scattering workshop this year was held fully online, but that did not prevent us measuring a large amount of mailed-in samples for these scientists to work on. This workshop was evaluated very highly by the participants again, which positively offsets the effort that goes into organizing it.

More evidence for a more streamlined measurement methodology can be seen from the number of supported users and number of samples measured. While the former increased slightly, the latter has risen dramatically, meaning that users have come with larger series of samples. These larger series are always welcome: it’s much easier to distinguish a trend in a series of 10 samples rather than a series of 4 samples. Especially when one or two samples are not quite as expected.
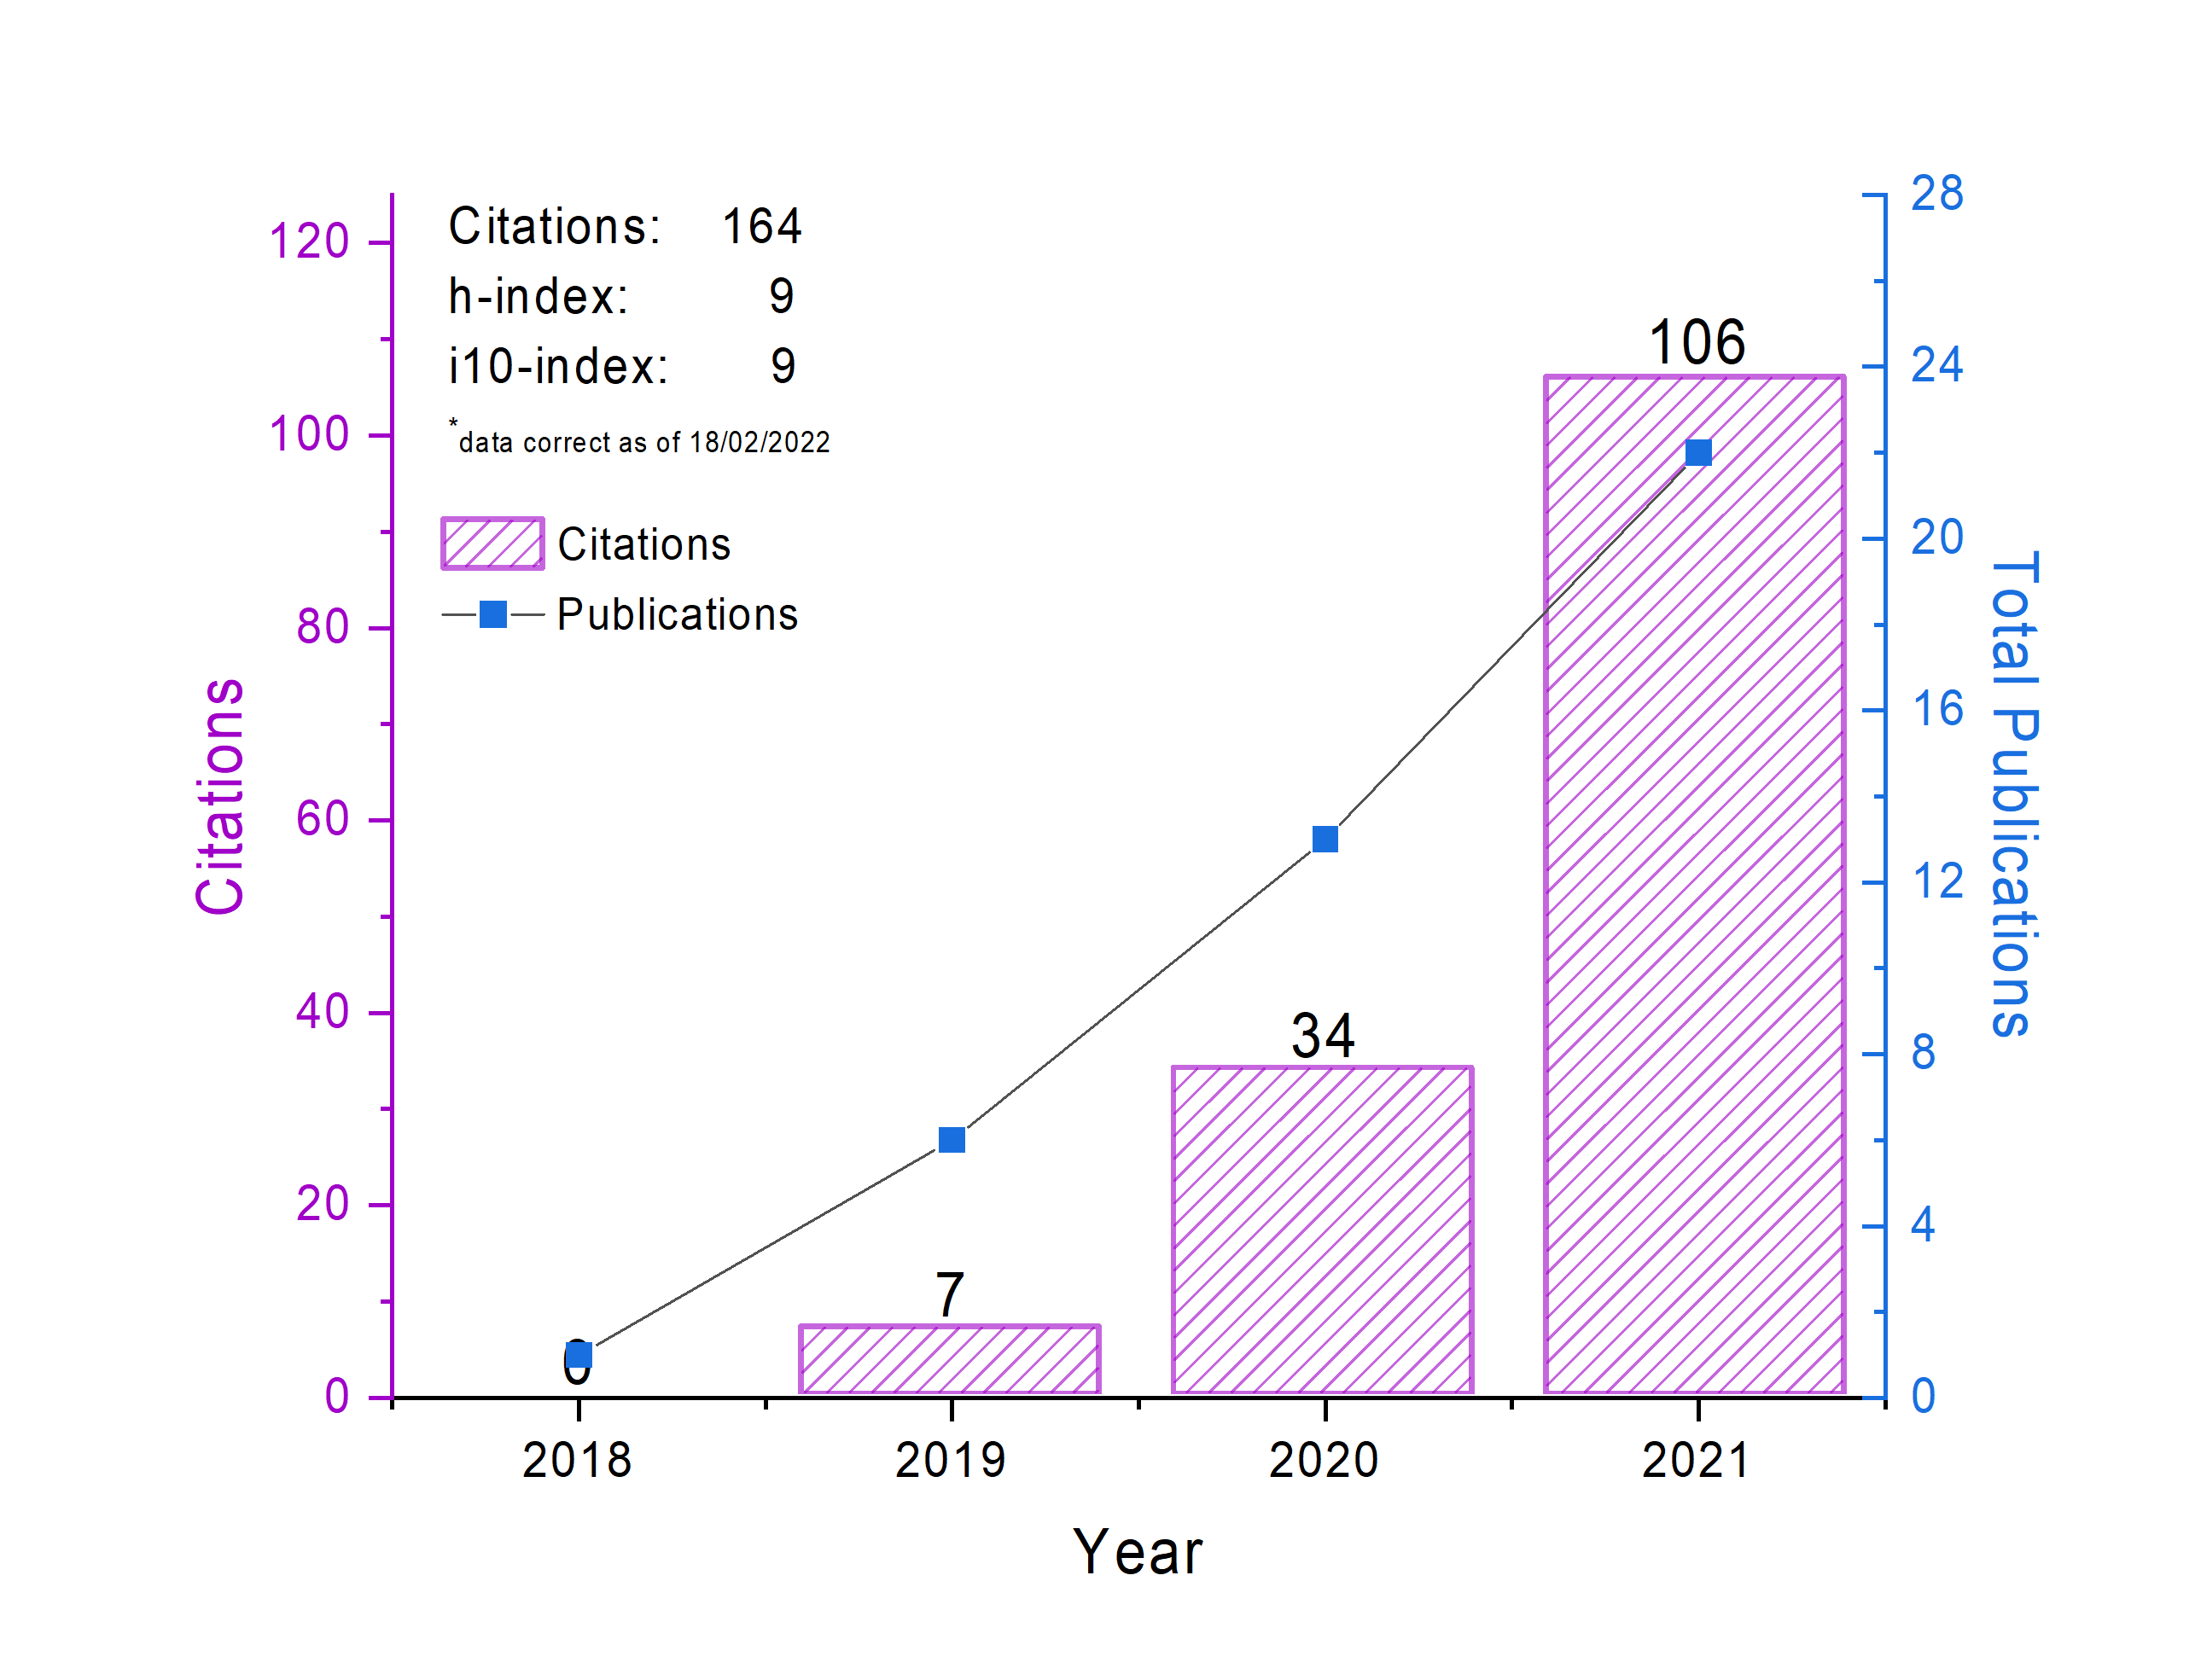
Measurements are one thing, but the work that takes up 90% of our time is the analysis and interpretation. This remains a part of scattering that is hard to automate, and so we are left making custom analysis models for each set of samples, with frequent video calls with the materials scientists from whom they originate. This is then compiled into publications, which are subsequently (hopefully) cited. These, in the end, are the quantifiable measurands of our efforts, but are far from all-encompassing (they fail, for example, to quantify outreach and teaching efforts, or impact on the quality of the results). Despite that, it’s nice to see from Figure 5 that we’re gaining considerable ground in these measurands as well.
2022 will be an interesting year with perhaps some drastic changes – we’re heading into an uncertain future. Whatever the future will be, however, with our highly automated methodology in place we can very accurately quantify the performance afterwards!
Leave a Reply