

Are you curious how much you can gain by automating of your methods and instrumentation? The operational stats for the MOUSE including 2023 are now avalable! Click on for the reveal and some side notes…
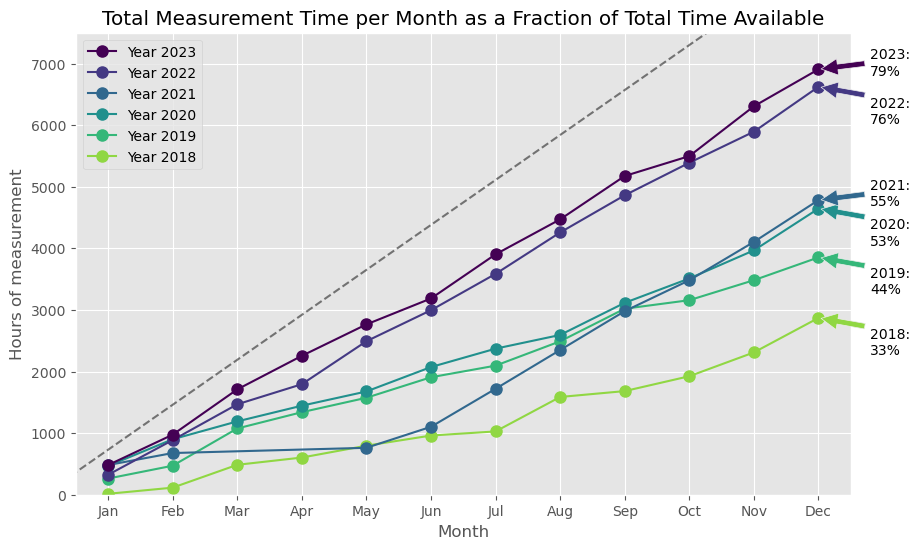
Figure 1 shows that we managed to measure a slight bit more than we did in 2022, and almost 2.4 times more than we managed in 2018! In other words: don’t buy more machines, you can get twice the measurements out of your existing instrumentation by optimizing your holistic measurement and data workflows (if your machine allows it)… It is clear from the slopes of these curves, however, that we are now pretty much at the operational limit of the system in its current iteration, and there isn’t much more that can be gained.
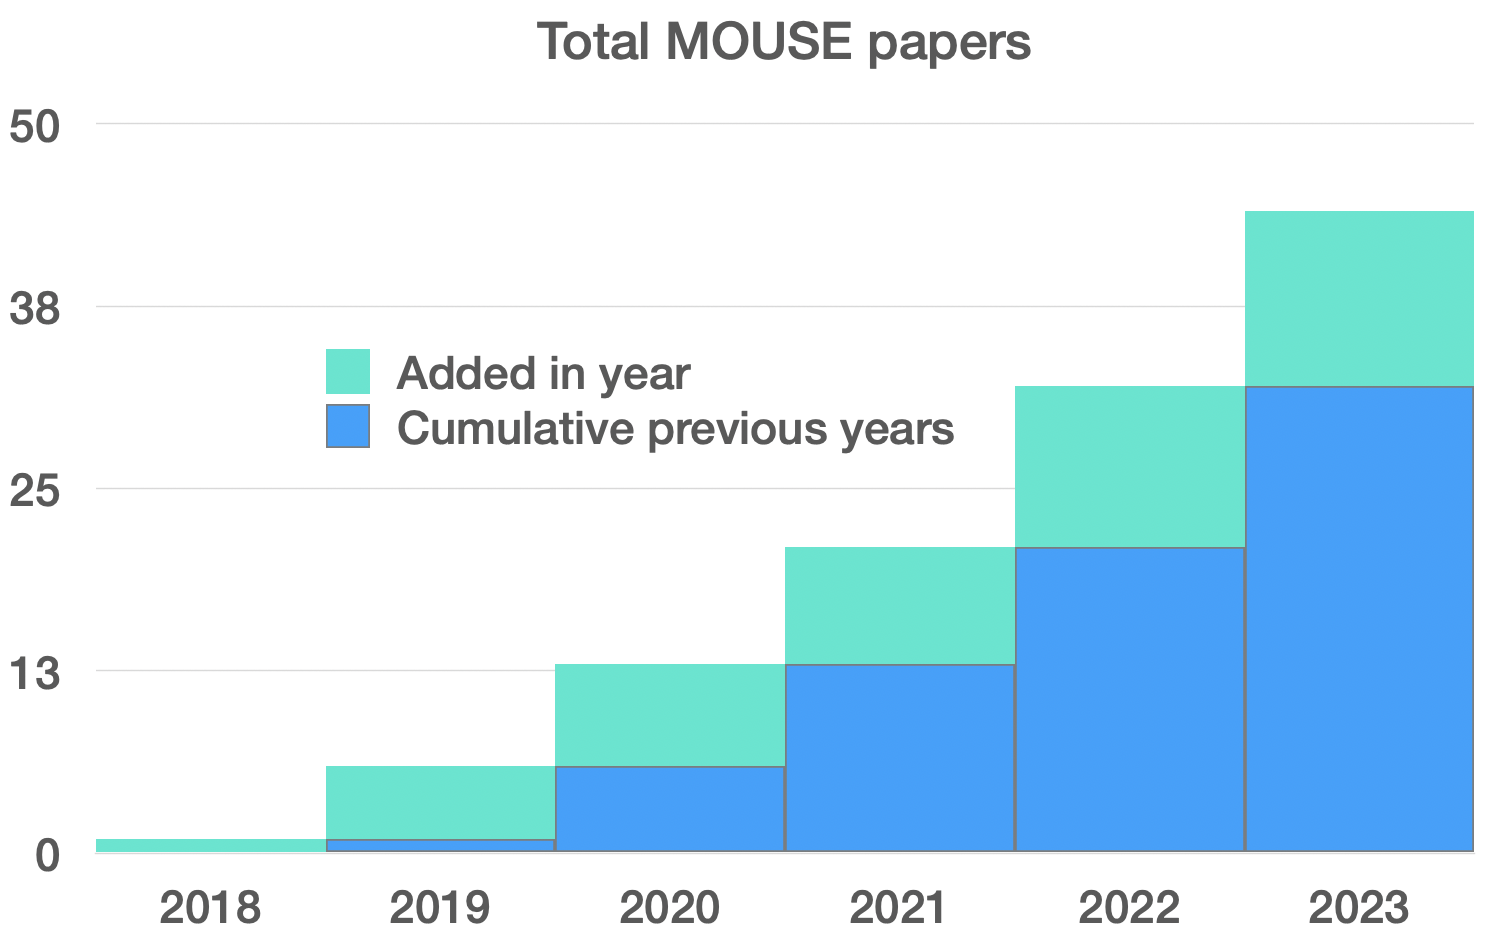
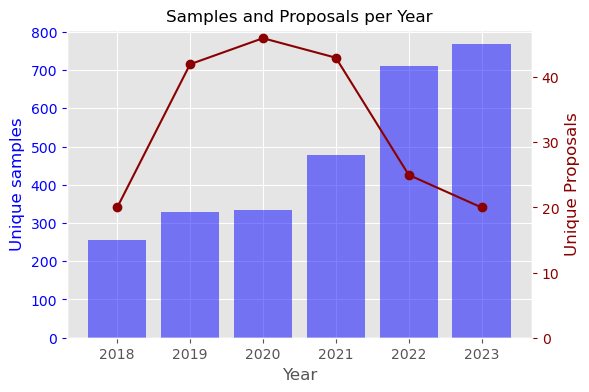
There is trouble on the horizon, though, as we lost more than 50% of user support capacity with the end of Glen’s contract. This particularly affects the in-depth data analysis and user guidance we can provide, and the effect of this can be seen in the reduction of projects we have supported (Figure 2). This, in turn, will result in a significant drop in publication numbers in the coming years. For now, it still is looking good, and with continued cross-institutional collaboration, the impact might be lessened.
The number of unique samples has been maintained, though, with nearly 800 samples being measured on the MOUSE in 2023. It was a great benefit to have hundreds of samples that Glen and Aaron synthesised with the help of our robotic platform. During times when we were otherwise occupied, we could slap in a few of those sample holders and measure more of those metal-organic framework samples, which kept measurement times up last year.
Besides those ubiquitous MOF samples, we also did quite a few non-standard measurements. For one, we got started with Grazing Incidence and reflectometry measurements, this being the research topic of our new Horizon Europe-funded post-doc colleague. We also measured squid pen for our Master’s student, aerogels, composites, in-operando batteries, as well as fats at different temperatures. Our collection of sample environments and custom holders is steadily growing, which, together with improvements on the machine hardware and software side, makes the lab an ever-exciting place to be.
This year, we will spend some time on further core hardware and software improvements, hopefully leading to more automation and data collection. Let’s see what this year will bring, I will keep you informed!