

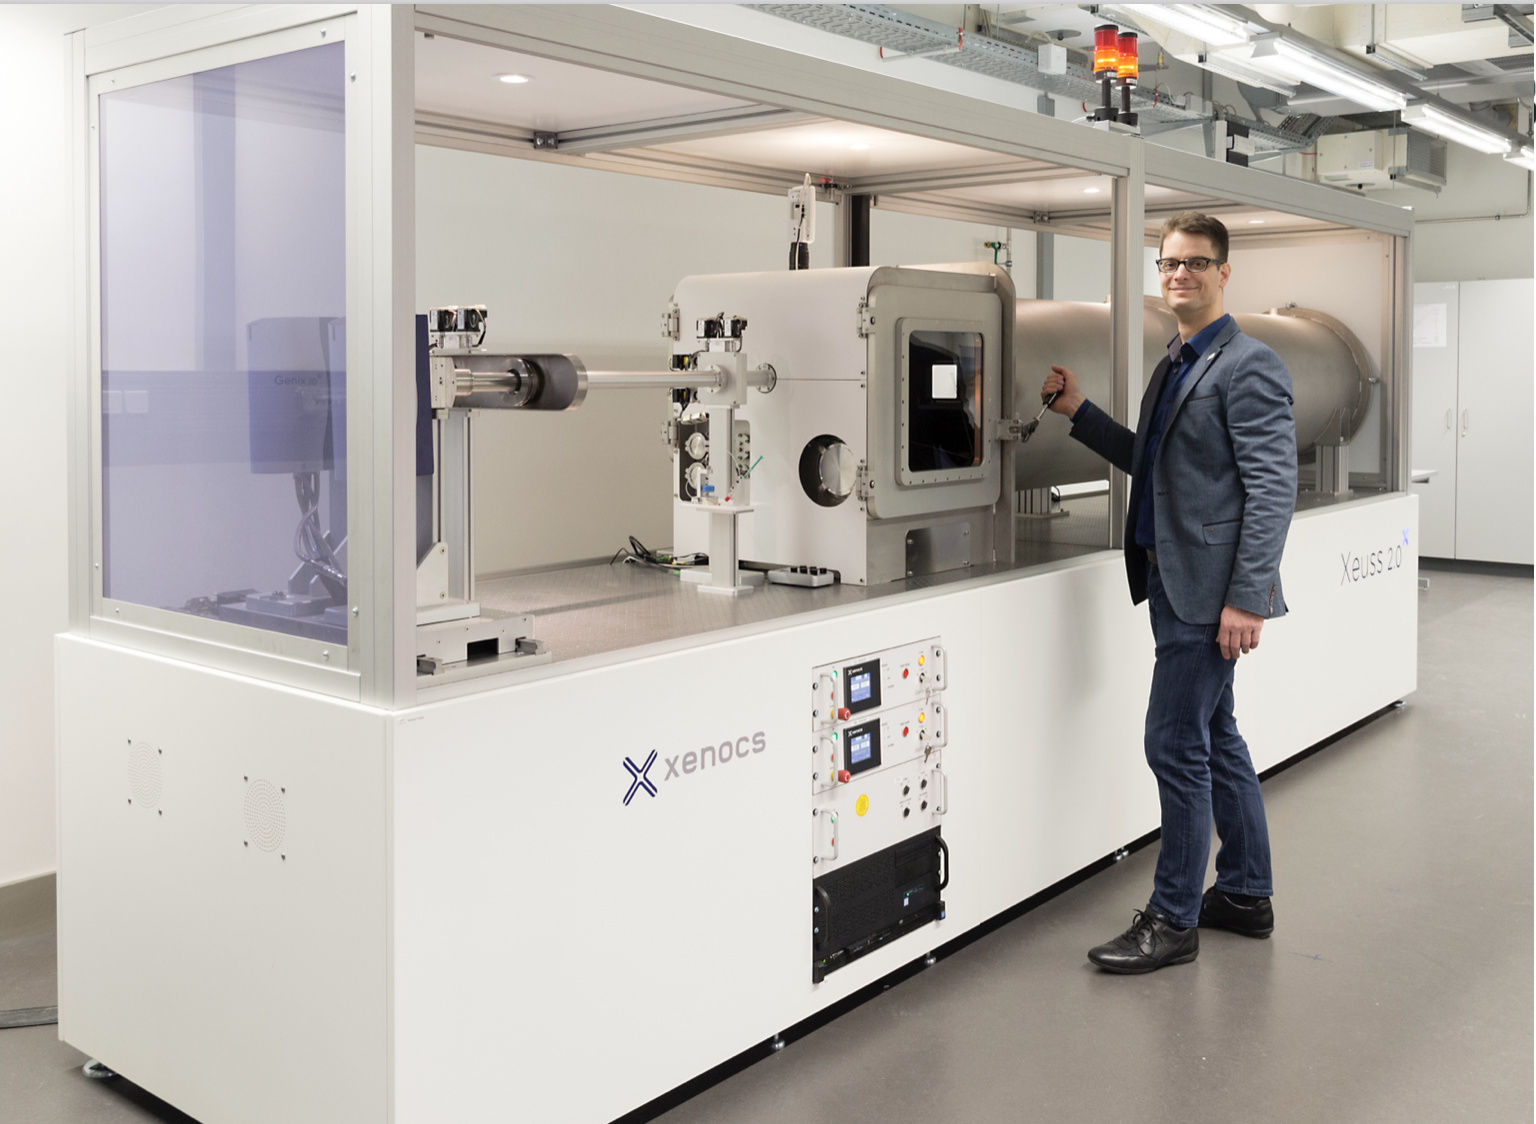
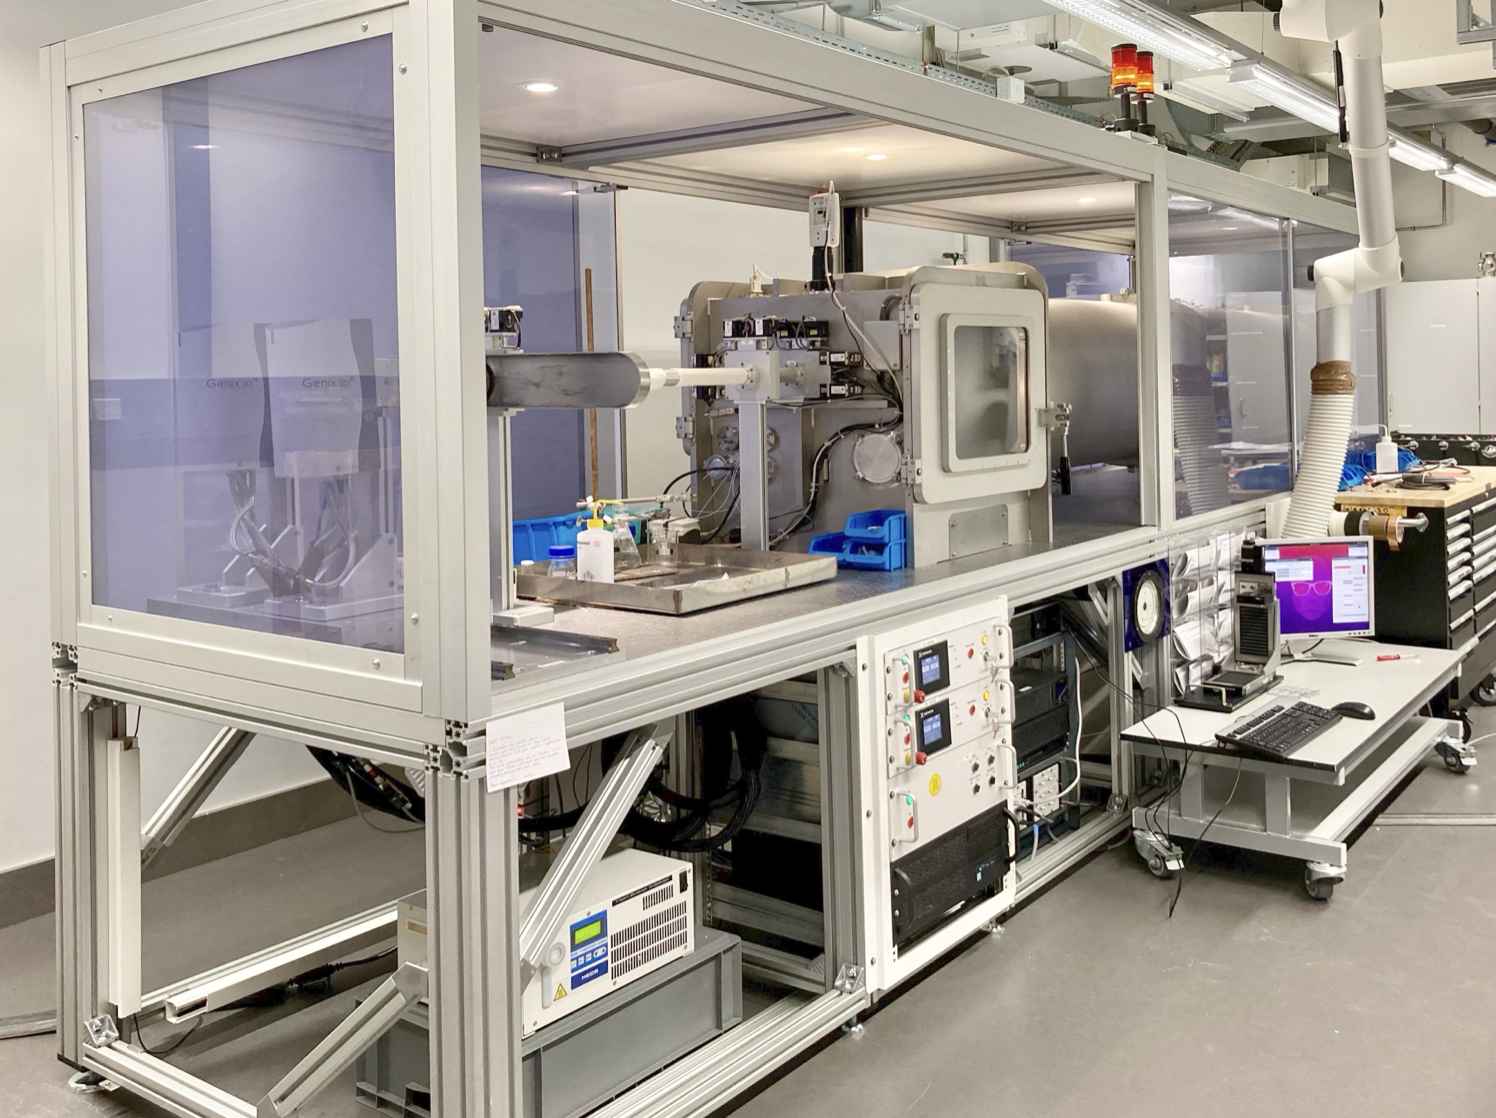
Regular readers will know we are in the process of migrating away from the last vestiges of the original SPEC-based control system on our (already highly customized) Xenocs Xeuss 2.0 instrument, i.e. the MOUSE. While we’ve been doing this so far in a rather unorganised whatever-comes-first manner, the next month we will have a few visitors capable of helping us with this. So it’s time to make a list and a plan, which could be useful to those of you who also wish to, for lack of a better word, further “liberate” their machines.
The backstory (skip if you’ve heard this one!)
In the beginning, there was…
The original software that came with the instrument was okay, with a graphical user interface allowing for various standard measurements to be done using a moderately user-friendly interface. Back then, the Foxtrot software by the SWING team from Soleil was added to allow some data reduction to take place. For scripting of measurements, one could fall back to SPEC programming. Such a ‘human-in-the-middle’ working style, while tedious and a bit fiddly, poses no major hurdles for the casual measurement.
But it can make one feel constrained and limited: if you stick within the boundaries set by the manufacturer, you will never do more or better than they envisioned (and we can envision a lot!). The original set-up also precluded a drive towards more automation and tighter integration of equipment. Talking to some other instrument scientists – and not limited to SAXS – this feeling seems to be very common.
We can see how even a few small improvements here and there which would greatly improve either the data quality or ease-of-use in our methodology, but we are unable to implement these without in-depth, documented access to the instrument controls and voiding warranty. Blocked by this, we simmer in our impotence to make these changes, devolving into a bunch of grumbling, middle-aged scientists; fondly “remembering” the age when machines would proudly come with electrical diagrams and communications protocols as standard.
The changes we made…
So we almost immediately ditched the UI when we got our system, moving instead to an overarching methodology involving an electronic logbook with automatic script generation, first with manual DAWN data processing, then automatically (headless), then with automatic calibrations, automatic thickness determination, eventually adding SciCat to catalog these steps, and RunDeck to manage this data flow.
More recently we added automatic data merging (from measurements in different configurations) and even a casual automatic data fitting procedure with McSAS3. On the hardware side, we replaced the sample motor controllers and sample stages, and added temperature controllers, environmental readouts, multi-position flow-through sample holders, a heated flow-through cell, a UPS (now retired), a new network switch, an EPICS server to handle some hardware, a prototype USAXS setup, now also a GISAXS set-up, and lots of feedthroughs for liquids, coolants and electrical connections. With all those changes, instrument performance and efficiency is through the roof, despite our understaffed laboratory.
But some of the core code still is SPEC, and after the motor controller incident leading to new sample motor controllers, we are hitting issues with SPEC. It is perfectly possible to call upon the OG programmer of SPEC, Gerry Swislow, to help us once more. Honestly, though, that would only be a stopgap solution until the next issue. And so it was as good a time as any to try moving away from the remnants. So, what do we need to do?
What direction to take?
So, after looking around at some of the alternatives (Bliss and Tango, to name but two, gleefully ignoring LabView), we decided to commit to an EPICS base. I’ve talked about this before, but it forms the basis of many synchrotrons, neutron sources as well as their instruments and therefore will be around for a while. It has the added advantage that it is open source, and you can put Ophyd + BlueSky on top, which form a modern user interface that is suitable for close integration and interaction with both instruments as well as their data pipelines. Both are programmed and supported by a large user base, and already contain drivers for much of the hardware we need to interact with. The only downside is that they are usually installed and maintained by dedicated teams at large facilities, not one or two people at small laboratories. Can we successfully install and adapt the bits we need?
The upcoming changes
We need to make the following changes:
Adding a new server
This one was relatively easy, our IT supplied a modern server with two network cards, modest memory (32GB) and an SSD. This one has had Ubuntu LTS installed on it as a base, on which we will run the many IOCs, some dashboards and perhaps RunDeck.
Controlling Schneider MDrive/MForce motors
Besides the sample motors, we must also be able to drive slit motors and detector motors. These are driven by variants of what is now Schneider Electric’s MDrive/MForce style motors over an RS485 bus. Fortunately for us, these motor drivers are supported by the enormous ANL-developed SynApps package. Unfortunately for us, installation of these outside of ANL is not a quick fire-and-forget operation, and so my colleague Ingo is spending some spare moments in an effort to try and get these running on normal installations. Compilation has (as of yesterday) succeeded, so now we have to find out how to configure these and get them to run.
Addressing and reading out the detector directly
For our new GISAXS experiments, Anja has been interacting with the Dectris detector directly, stealing control away from the Xenocs system when needed. This is going reasonably fine, and we are collecting the nicely informative NeXus files directly from the detector for further processing, be it immediate for scanning functionality, and directly storing these on our networked server for detailed analysis. Extending this to also take over the measurements for our standard transmission measurements might be easy. Alternatively, probably at a later stage when BlueSky comes into the picture, we can use the EPICS/SynApps drivers for the detector too.
Generator control
We do not need generator control as such, but only need to be able to read out its status and flip the shutter open and closed. For this, Xenocs has been kind enough to provide sufficient information to me, so that I could write a small EPICS IOC using Caproto to expose this functionality to the machine network. I’m still struggling with (a perhaps unnecessary) asynchronous handling library, but other than that, it should run fine soon.
Valves control
The vacuum and compressed air system is controlled using a few valves. These valves are driven by a small ethernet-attached relay interface, which would be no problem to reuse. However, I’ve become enamoured by the new Arduino Portenta Machine Control (PMC), and so I am planning to use this instead. I have written an EPICS IOC using Caproto to expose the PMC functionality to the EPICS network, simultaneously reading out some environmental parameters (temperature, pressure, humidity, dewpoint and volatile chemicals). This IOC is in beta, but available here for you to use and (hopefully) contribute. More on this Arduino in a separate post once it has its pretty 19″ box around it that the workshop is working on right now.
A UI for managing microservices
All this talk about IOCs must make you wonder how we want to manage all these little server programs. They launch with nothing more than a command-line command splattered with a few options, and in principle run in a screen without issue. However, when you have a few of them, it is easy to lose track of which is doing what. So I wrote a small Dash dashboard to launch and keep track of these, and at the same time show a little graph on the system and network resources load. That dashboard is available here for you to use and (hopefully) contribute (it bears repeating).
On second thought, we might just run another RunDeck instance on this server to manage these (the same software we use for managing our data pipeline), since that does 90% of the above, and is the more pragmatic solution. Too bad about the time spent writing my own, but I learned a few more things in the process of writing it.
An IOC for tracking metadata
So there is some information the machine never knows. This includes information such as who is running the measurements, who owns the samples, what sample is being measured, what its composition is (with SLDs and absorption coefficients), what proposal this is for, and many more. To make it easier for us to record this later in the NeXus files, and to help us eventually build a dashboard showing the current status of the instrument complete with names and sample information (see below), we need this information exposed. So a little, easily extensible “Parrot” IOC needs to be built that does nothing more than keep track of a few strings and numbers.
Moving the generator control boxes upstream
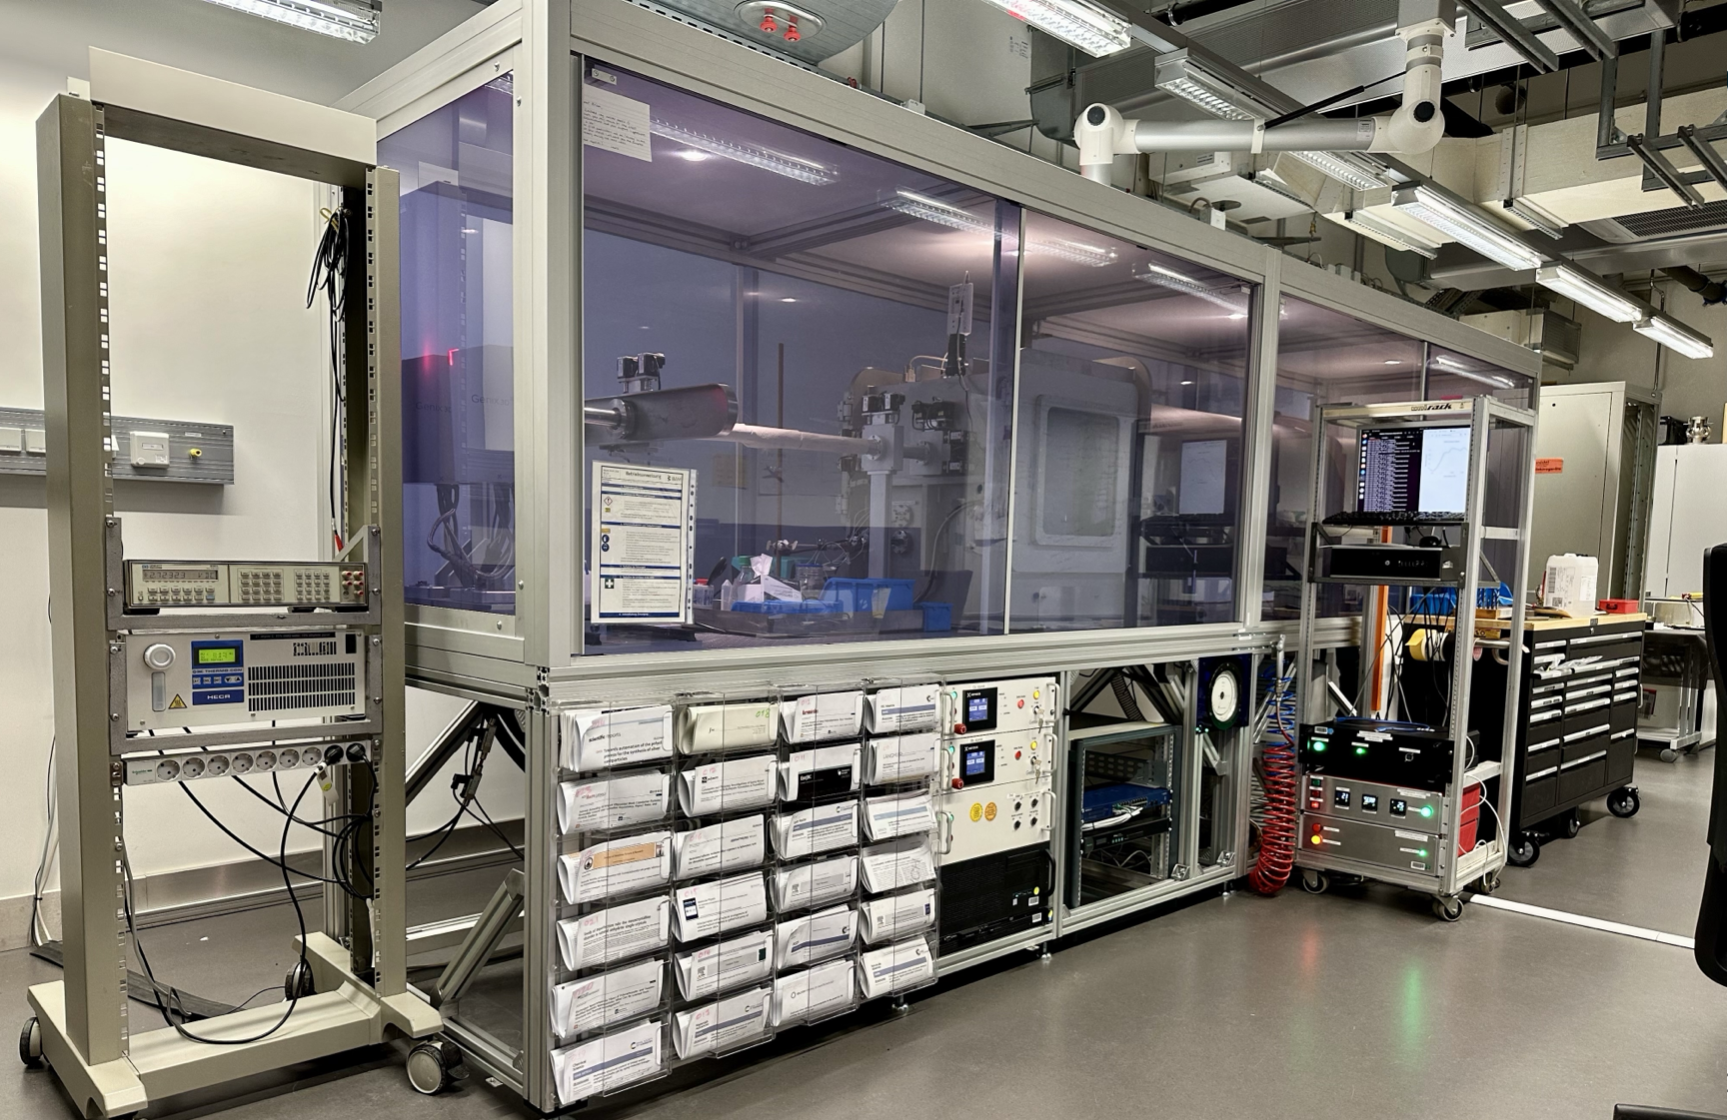
This is pretty much completely unnecessary, but I want to do it anyways. Underneath the MOUSE, the cabling is a bit of a mess. Part of the reason for this is that most electronics boxes are centrally positioned, some with thick cables, leading to this mess. I like tidy cables and tidy interiors, so this irks me. One way to tidy this up is to move the control boxes sideways, next to where the X-ray sources themselves are, letting us compartmentalise the cabling a little. In my mind, it would also reduce the risk in case of a large liquid spill on top of the optical table, but there is still plenty of hardware underneath to make that problematic if it were to happen. One step further, though.
Changing the workflow programs.
At the end, the scripting engine needs to be reworked so it can make measurement scripts for the new system. Likewise, the program that did the NeXus-to-NeXus translation from the Xenocs and Dectris base files into a nice comprehensive NeXus file DAWN could work with, needs to be modified to work with the new information sources. Likewise, there are probably a few other steps in the workflow that need some adjustment before it works as smoothly as it did before (and hopefully even more smoothly). This story will have a bit of a tail.
Stretch goal 1: An ultimate, pure pythonic data processing pipeline
Before the end of last year was so rudely interrupted with a hardware failure, I had started working on an upgraded pythonic dataclass (a data carrier) to use with a comprehensive data processing pipeline (we talked about this before). That would be useful not just for data correction, but also for any subsequent steps you want to tack on at the end such as in-line data analysis steps or ML-based categorisation, classification and tagging steps. This is a large project for which we’ll need to get a few heads together. More on this at a later stage.
Stretch goal 2: A better UI for loading sample information and measurement settings
While Excel has its strengths (user familiarity, flexibility, good at making series and sequences), it also has many drawbacks. This is exemplified by the information we get from users, who have no problems inserting “~2.3 to 2.8” in nominally machine-readable density fields, copy-pasting images of ChemDraw structures (with lots of unknown n‘s and x‘s) in another machine-readable atomic composition field, or just ignoring the whole structure and writing a detailed text description of their sample. This is not their fault; Excel allows you to do these things. But it does make life hard for those of us who want to automate certain aspects such as X-ray absorption and SLD calculations.
Stretch goal 3: A live ops dashboard.
Lastly, wouldn’t it be cool to see the latest frames pop up on a dashboard in the coffee room and office, with the sample information and other live statistics coming up? Stay tuned for that.